

As of October 12, Bitcoin’s price has surpassed $84,000, yet ongoing challenges such as diminishing institutional interest, high Treasury yields, and resistance near the $85,000 mark are hindering its upward momentum.
Summary
- Bitcoin has reclaimed its position above $84,000 but encounters strong resistance around $85,000 after multiple attempts to break through $87,000.
- Withdrawals from U.S. spot Bitcoin ETFs and climbing Treasury yields have diminished demand, although there was a slight recovery in fund flows on Friday.
- Bitcoin remains above key daily moving averages, with the Aroon Up indicator at 71.43%, signifying that buyers still possess a slight edge.
- The MACD on the four-hour chart has turned positive, and the Chaikin Money Flow reading of 0.20 indicates growing buying activity.
- A breakthrough above $85,000 could pave the way to $86,500 and $87,400, with immediate support located around the 20-day EMA at approximately $83,386.
Current data from TradingView shows Bitcoin (BTC) trading at roughly $84,234, a 0.55% increase for the day. The cryptocurrency reached a daily high of $84,290 after bouncing back from a low of $83,462.
This rebound comes after a challenging week for Bitcoin, which saw its price dip toward $80,000 as it struggled to hold gains above $87,000 multiple times.
While buyers have returned to the market at lower price points, recent withdrawals from U.S. spot Bitcoin ETFs and uncertainty surrounding the Federal Reserve’s next interest rate move have made traders wary.
Technical indicators suggest a rise in buying momentum, with Bitcoin trading above its significant daily moving averages. However, it must surpass $85,000 to challenge its recent highs effectively.
Bitcoin Price Faces Downward Pressure
Institutional interest in Bitcoin has significantly dropped since late September, a period when U.S. spot Bitcoin ETFs attracted about $2.39 billion in weekly inflows.
Data from Bitfinex Alpha reveals that weekly inflows fell to $241.1 million for the week ending October 2, marking a decrease of nearly 90%.
As previously noted by crypto.news, analysts at Bitfinex believe Bitcoin’s inability to break through $87,000 is partly due to insufficient spot demand, despite heightened activity in the futures market.
The analysts observed that futures open interest surged by $2.1 billion ahead of the September U.S. employment report, only to drop by $1.5 billion as Bitcoin’s price retreated.
In their evaluation, leveraged trading contributed to price increases without adequate direct purchasing to sustain those gains.
ETF outflows worsened the following week, with U.S. spot Bitcoin ETFs noting $484.9 million in net withdrawals on October 7, followed by another $244.1 million on October 8.
A slight recovery occurred on Friday, with net inflows of $21.1 million on October 9. However, this uptick fell short of offsetting earlier losses.
Broader macroeconomic conditions have also posed challenges for Bitcoin.
U.S. Treasury yields rose alongside increasing oil prices, affected by geopolitical tensions in the Middle East, while a stronger dollar has hampered demand for risk assets.
The benchmark 10-year Treasury yield exceeded 5.3% in early October, making government debt more attractive to investors seeking stable returns.
Additionally, uncertainty surrounding Federal Reserve policies remains a concern.
Federal Reserve Vice Chair Philip Jefferson recently indicated that more time may be necessary before considering another interest rate hike.
Despite improving expectations of a pause in October, inflation continues to be a troubling factor following the rate increase in September.
Bitcoin’s gradual recovery on Monday has coincided with some easing in oil prices and geopolitical issues, helping improve risk sentiment after last week’s sell-off.
Traders are now looking forward to the September U.S. Consumer Price Index report scheduled for October 14, which could impact expectations for the Fed’s policy meeting on October 27-28.
Market Indicators Show Signs of Improvement
Despite its struggle to reclaim $85,000, Bitcoin’s daily technical setup remains optimistic.
According to the daily TradingView chart, BTC was trading at $84,233.79, above its 20-day exponential moving average at $83,385.98 and its 50-day EMA at $80,216.67.
The 100-day and 200-day EMAs are positioned lower, at $76,415.76 and $75,553.33, respectively.
Because shorter moving averages are still above longer ones, this configuration suggests that Bitcoin’s recovery trend remains intact.
The 20-day EMA serves as the first significant support level should Bitcoin lose momentum around $84,000.
A daily close under $83,386 could bring the $82,000 level into focus, while a more significant drop could necessitate monitoring the 50-day EMA near $80,217.
The Aroon indicator reflects a similar sentiment, though its latest readings point to a slight reduction in trend strength.
The 14-period Aroon Up stood at 71.43%, compared to Aroon Down at 28.57%.
This disparity suggests that recent highs exert more influence than recent lows, indicating that buyers maintain control over the daily trend.
However, Aroon Up’s recent decline from higher readings indicates that the bullish move has decelerated since Bitcoin approached $87,000.
The market has been facing a barrier around that price several times since late September.
In an analysis on October 6, the repeated rejection of Bitcoin near $87,000 was linked to a concentrated resistance zone, with analysts identifying about 1.59 million BTC acquired between $83,300 and $84,600.
Utilizing data from Glassnode’s realized price distribution, these purchases could offer support if Bitcoin revisits that range.
According to their analysis, the next significant breakout level is estimated around $86,700.
Indicators on shorter timeframes have become more positive as Bitcoin recovers from last week’s downturn.
The four-hour chart shows the Moving Average Convergence Divergence (MACD) indicator entering bullish territory, with the MACD line at 207.64 and the signal line at 75.07.
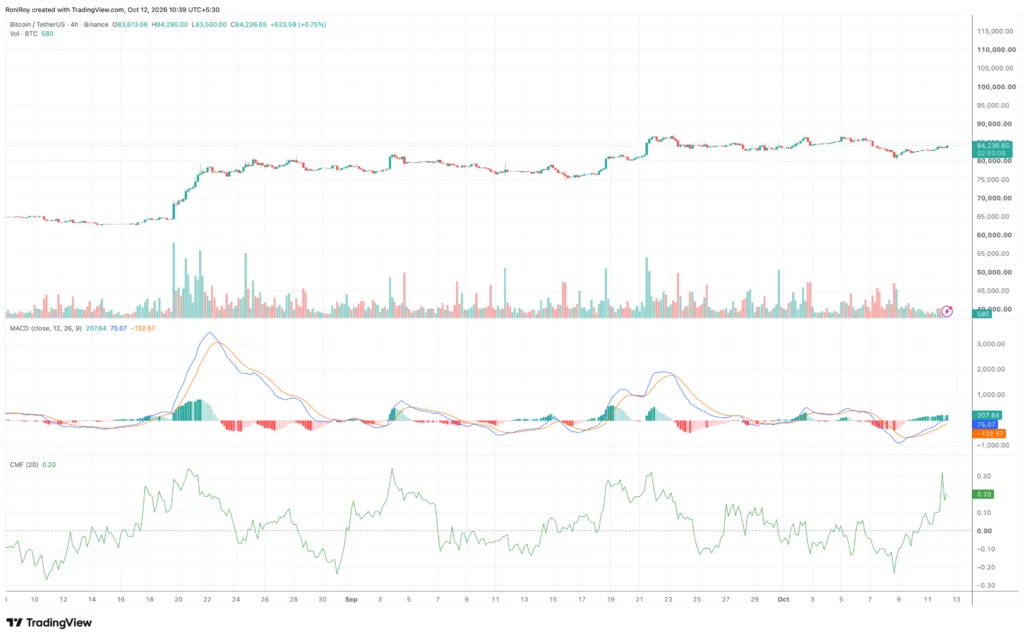
The positive histogram value of 132.57 indicates that the MACD line is now above its signal line, which shows improving momentum during the recovery phase.
A sustained positive histogram could facilitate another attempt to surpass $85,000, especially if Bitcoin manages to hold above the recent intraday high of $84,290.
The Chaikin Money Flow indicator also offers an encouraging signal.
Currently, CMF is at 0.20, recovering from a previous downturn during the recent selloff.
A positive rating suggests buying pressure has surpassed selling pressure throughout the measurement period.
The latest reading has decreased from a recent high of around 0.30 but remains comfortably above zero.
Will Bitcoin Cross the $85,000 Threshold?
Bitcoin’s immediate goal is to maintain trading above $84,300 before making another attempt toward $85,000.
A strong break above this psychological barrier could bring $86,500 into play, followed by the resistance zone between $87,000 and $87,400 that has continually halted previous rallies.
Should conditions improve regarding spot demand, the $90,000 target remains within reach.
Analysts at Bitfinex previously noted that a daily close above $87,722, supported by several ETF sessions attracting a minimum of $340 million each, could enhance the case for reaching $90,000.
The downside risk begins with the 20-day EMA located around $83,386.
A failure to uphold that average could lead to a test of the $82,000 level, identified by experts like ViaBTC chief analyst Jeff Ko and Bitget Wallet’s research lead Lacie Zhang as critical support.
In their October market assessment, they pointed to institutional purchases, inflation data, and Treasury yields as key factors shaping Bitcoin’s direction.
Zhang highlighted a potential liquidation area between $82,000 and $82,500, suggesting that losing this range could trigger a drop toward $80,000.
The 50-day EMA at $80,217 is situated near this psychological support level, serving as an additional technical reference should selling accelerate.
A more profound correction could bring the 100-day EMA near $76,416 into play, although that scenario would necessitate a significant deterioration in the current price structure.
Disclosure: This article does not constitute investment advice. The information provided here is for educational purposes only.