

On October 16, Bitcoin was trading around $81,400 after bouncing back from a weekly low of $79,800. Its recovery now hinges on maintaining above the 50-day moving average while overcoming a series of lower highs.
Summary
- After dipping below $80,000 earlier in the week, Bitcoin was hovering near its 50-day moving average at $81,279.
- Trader Ardi noted that breaking through $84,200 is essential to disrupt the current bearish trend.
- The weekly Relative Strength Index (RSI) remained above 50, although the daily chart indicated a lack of short-term momentum.
- CoinGlass’s heatmap for the week unveiled significant liquidation points between $84,300 and $84,700.
As of 5:38 p.m. UTC, Bitcoin’s daily price chart showed $81,345.75, reflecting a decrease of 1.09% for the session. A minute later, the weekly chart indicated a price of $81,449.99, down 2.77% since the week began.
The recovery moving past $80,000 has preserved vital support, yet Bitcoin has been unable to build on this momentum. Following its rally towards $87,000 in September, subsequent recovery efforts have stalled below prior highs, bringing the price closer to its 50-day moving average.
Trader Ardi addressed this weakening structure in an October 16 post on X, contending that expectations for price improvements are not yet substantiated.
“Until we break $84.2K, you simply need to respect that the local swing structure is still bearish.”
He suggested that breaking above this pivotal point would lead him to contemplate long positions targeting the upper trading limits. His optimistic outlook thus relies on Bitcoin overcoming resistance rather than just bouncing off support.
Bitcoin’s recovery faces a familiar challenge around $82,000
The first hurdle is closer to the current trading level. Bitcoin must regain the $82,000 mark and sustain above the recent daily high of approximately $82,941 before the $84,200 threshold becomes relevant.
Earlier this month, the $82,000 level was highlighted by analysts. In assessments published on October 1, Jeff Ko from ViaBTC and Lacie Zhang from Bitget Wallet emphasized it as a crucial support point. Zhang cautioned that failure to maintain the $82,000–$82,500 range could lead to a swift decline towards $80,000, according to a report on Bitcoin’s October support.
Since then, Bitcoin has fluctuated through this critical support area. Regaining that level would add strength to the recovery, while another rejection would solidify the recent pattern of lower highs.
Crypto analyst Jesse Olson also expressed caution in a post on October 16.
“BTC remains bearish on the daily chart.”
Olson indicated that Bitcoin is approaching the lowest daily candle close of this correction phase. His analysis emphasized that despite the recovery from recent lows, the closing price trend continues to face downward pressure.
The 50-day moving average is undergoing a critical test
According to the daily chart, Bitcoin’s 50-day moving average stands at $81,279, only about $67 below the current price. This suggests Bitcoin is testing a trendline that has been supportive during its recovery since August.
Maintaining this average would provide a foundation for attempting to reach $82,000 again. A sustained drop below it could shift the focus back to the weekly low of $79,800.
The daily Aroon indicator suggests caution, with Aroon Up recorded at 0% and Aroon Down hitting 92.86%. This indicates that a recent low is driving the trend, while a new high remains elusive.
This aligns with the downward movement from the peaks of September and early October. The price has returned to key support without addressing the declining sequence identified by Ardi.
The longer-term trend shows considerable space beneath it. Bitcoin’s 200-day moving average is at $72,397, significantly lower than the current trading range, while the 50-day average remains above it following an earlier bullish crossover.
This current test is therefore concentrated around the 50-day average and the recent price lows. Falling below $80,000 would jeopardize the gains made in September before potentially threatening the more distant 200-day trend line.
Weekly momentum appears stronger than the daily trend
The weekly chart of Bitcoin suggests a less pessimistic scenario. The relative strength index is at 56.39, surpassing both the neutral 50 mark and its average of 51.80.
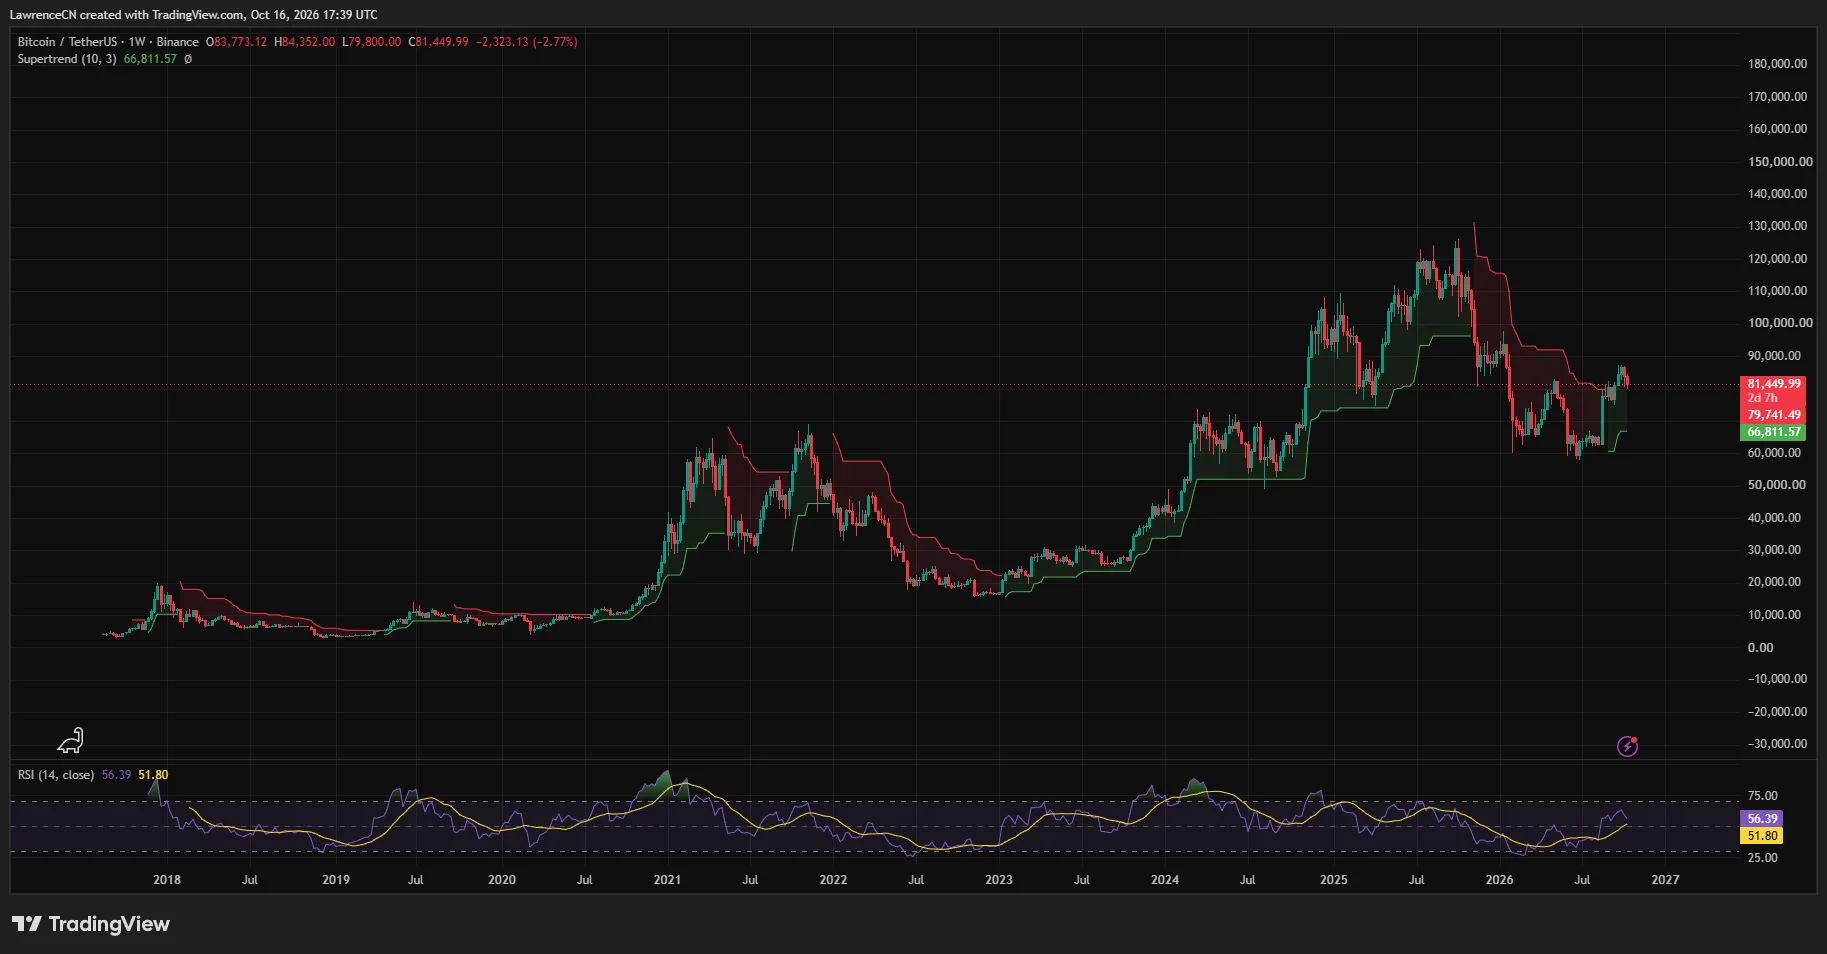
Thus, the weekly momentum has retained some vigor even as the daily price structure shows signs of weakness. The RSI has bounced back from its mid-year lows, but still falls short of the peak levels observed in earlier rallies.
The weekly Supertrend also remains bullish, with its active line positioned around $66,812. Bitcoin is trading well above this level, maintaining a positive signal for this indicator.
However, the distance to this line offers minimal protection against any near-term declines. Bitcoin could break down through its immediate support while the weekly Supertrend remains positive.
For the recovery narrative, clear confirmation would arise from Bitcoin surpassing recent lower highs while keeping the weekly RSI above 50. Until such a scenario, stronger weekly indicators coexist with a daily correction.
Liquidation clusters are forming above current market levels
CoinGlass’s weekly liquidation heatmap indicates a significant concentration of liquidations clustered around $84,300–$84,700, right above the breakout level identified by Ardi. Smaller clusters also appear near $83,300–$83,700.
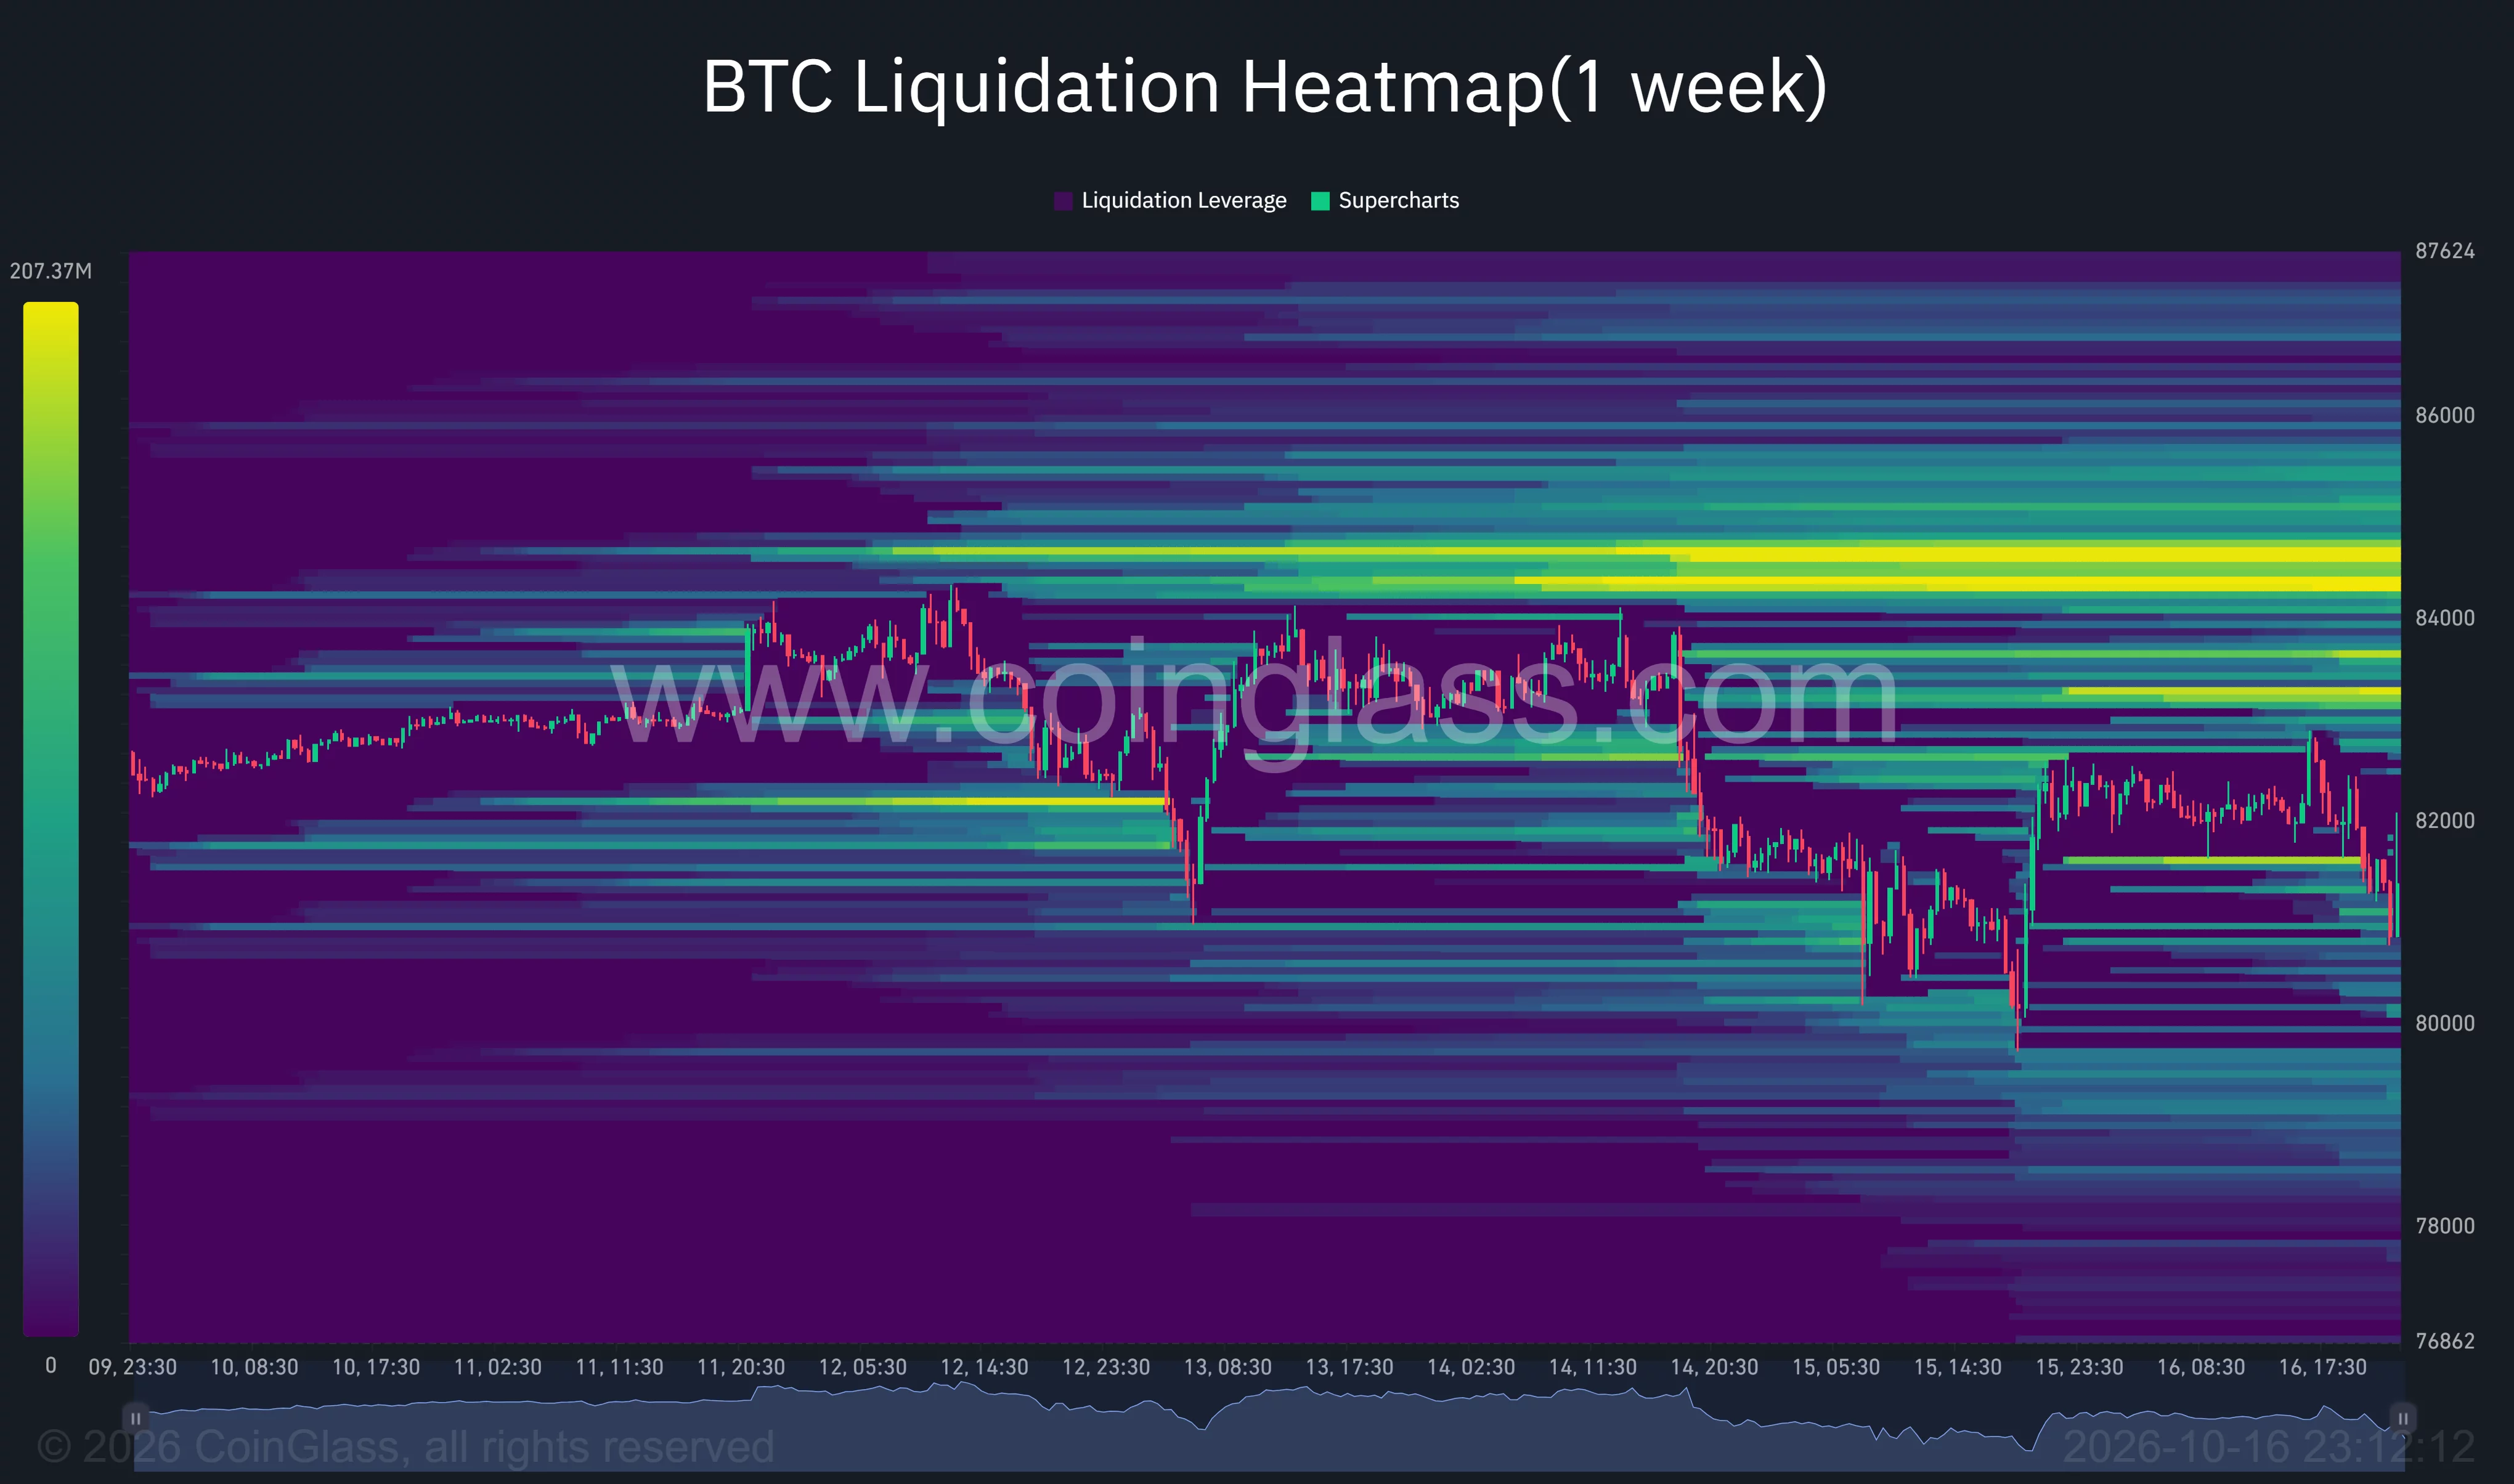
These anticipated liquidation levels present an additional challenge for a recovery beyond $84,200 in the derivative market. Hitting the larger liquidation cluster could prompt forced closures of short positions, although the heatmap does not guarantee a move towards this area.
Below current market levels, liquidation concentrations are visible around $80,000 and the range of $79,000–$79,500. A failure to maintain from the recent weekly low could draw attention back to this support area.
U.S. inflation remains a key player in this scenario. The Bureau of Labor Statistics reported a yearly increase of 3.7% in consumer prices for September, up from 3.4% in August. Ahead of this release, BTSE’s chief operating officer, Jeff Mei, cautioned that rising inflation could drag Bitcoin below $80,000, according to comments on the inflation risk to Bitcoin.
Bitcoin is currently facing tests at the $81,279 average along with the $79,800 weekly low. Maintaining this support level allows for another potential recovery attempt, yet a persistent break above $84,200 is vital to challenge Ardi’s bearish local perspective.
Disclosure: This article does not offer investment advice. The information provided here is for educational purposes only.