
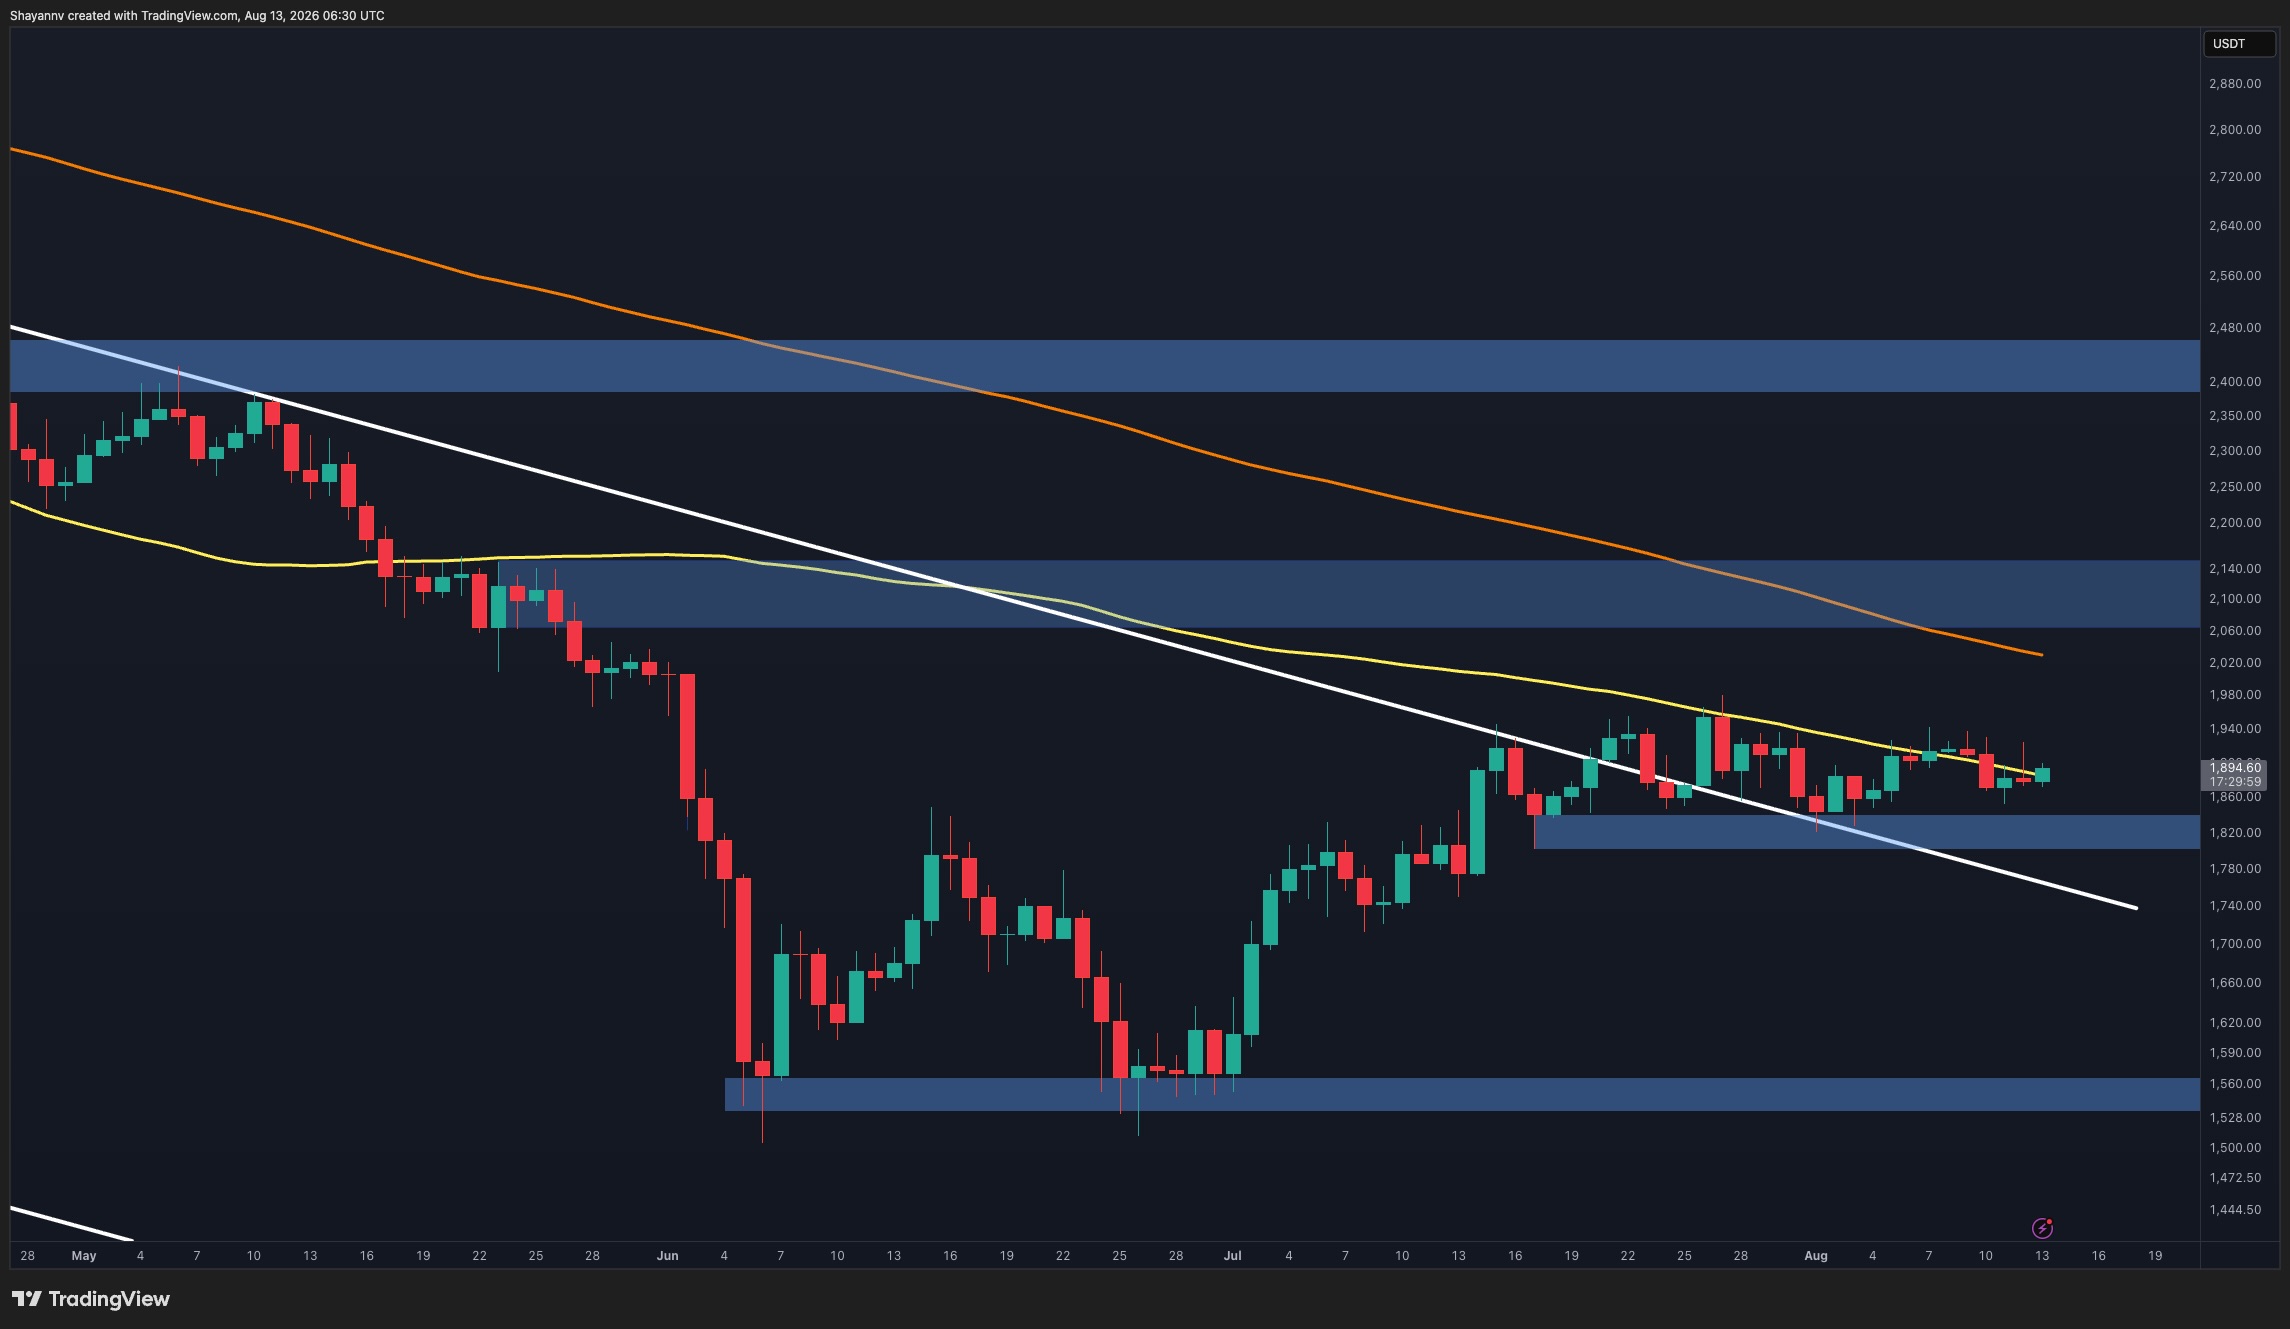
Ethereum is currently experiencing a lack of clear momentum, as its price remains caught in a phase of consolidation, even after recovering from the lows seen in June. The market is stabilizing around the 100-day moving average, with lower timeframes indicating that ETH is constricted between distinct support and resistance levels.
Ethereum Price Overview: Daily Insights
At present, ETH is trading near $1.9K, and the latest candlestick patterns reveal minimal directional intent. The most significant occurrence is the horizontal consolidation observed near the 100-day moving average, which is situated in a similar price range.
The market has fluctuated around this moving average several times without managing to create a lasting breakout in either direction. This stagnation implies that both buyers and sellers lack definitive control, resulting in a neutral consolidation phase for ETH in the short term.
However, the overall market structure remains precarious. On the upside, the resistance area between $2.06K and $2.15K poses the first major hurdle, with the longer-term moving average also approaching this range. An assertive move above this level would significantly bolster the case for a bullish trend shift.
The nearest support level is positioned around $1.81K-$1.84K. A dip below this zone would jeopardize the recent recovery, potentially revealing a more substantial demand zone between $1.53K-$1.57K. Until a clear breakout occurs on either side of the current range, price action is likely to remain confined.
ETH/USDT 4-Hour Analysis
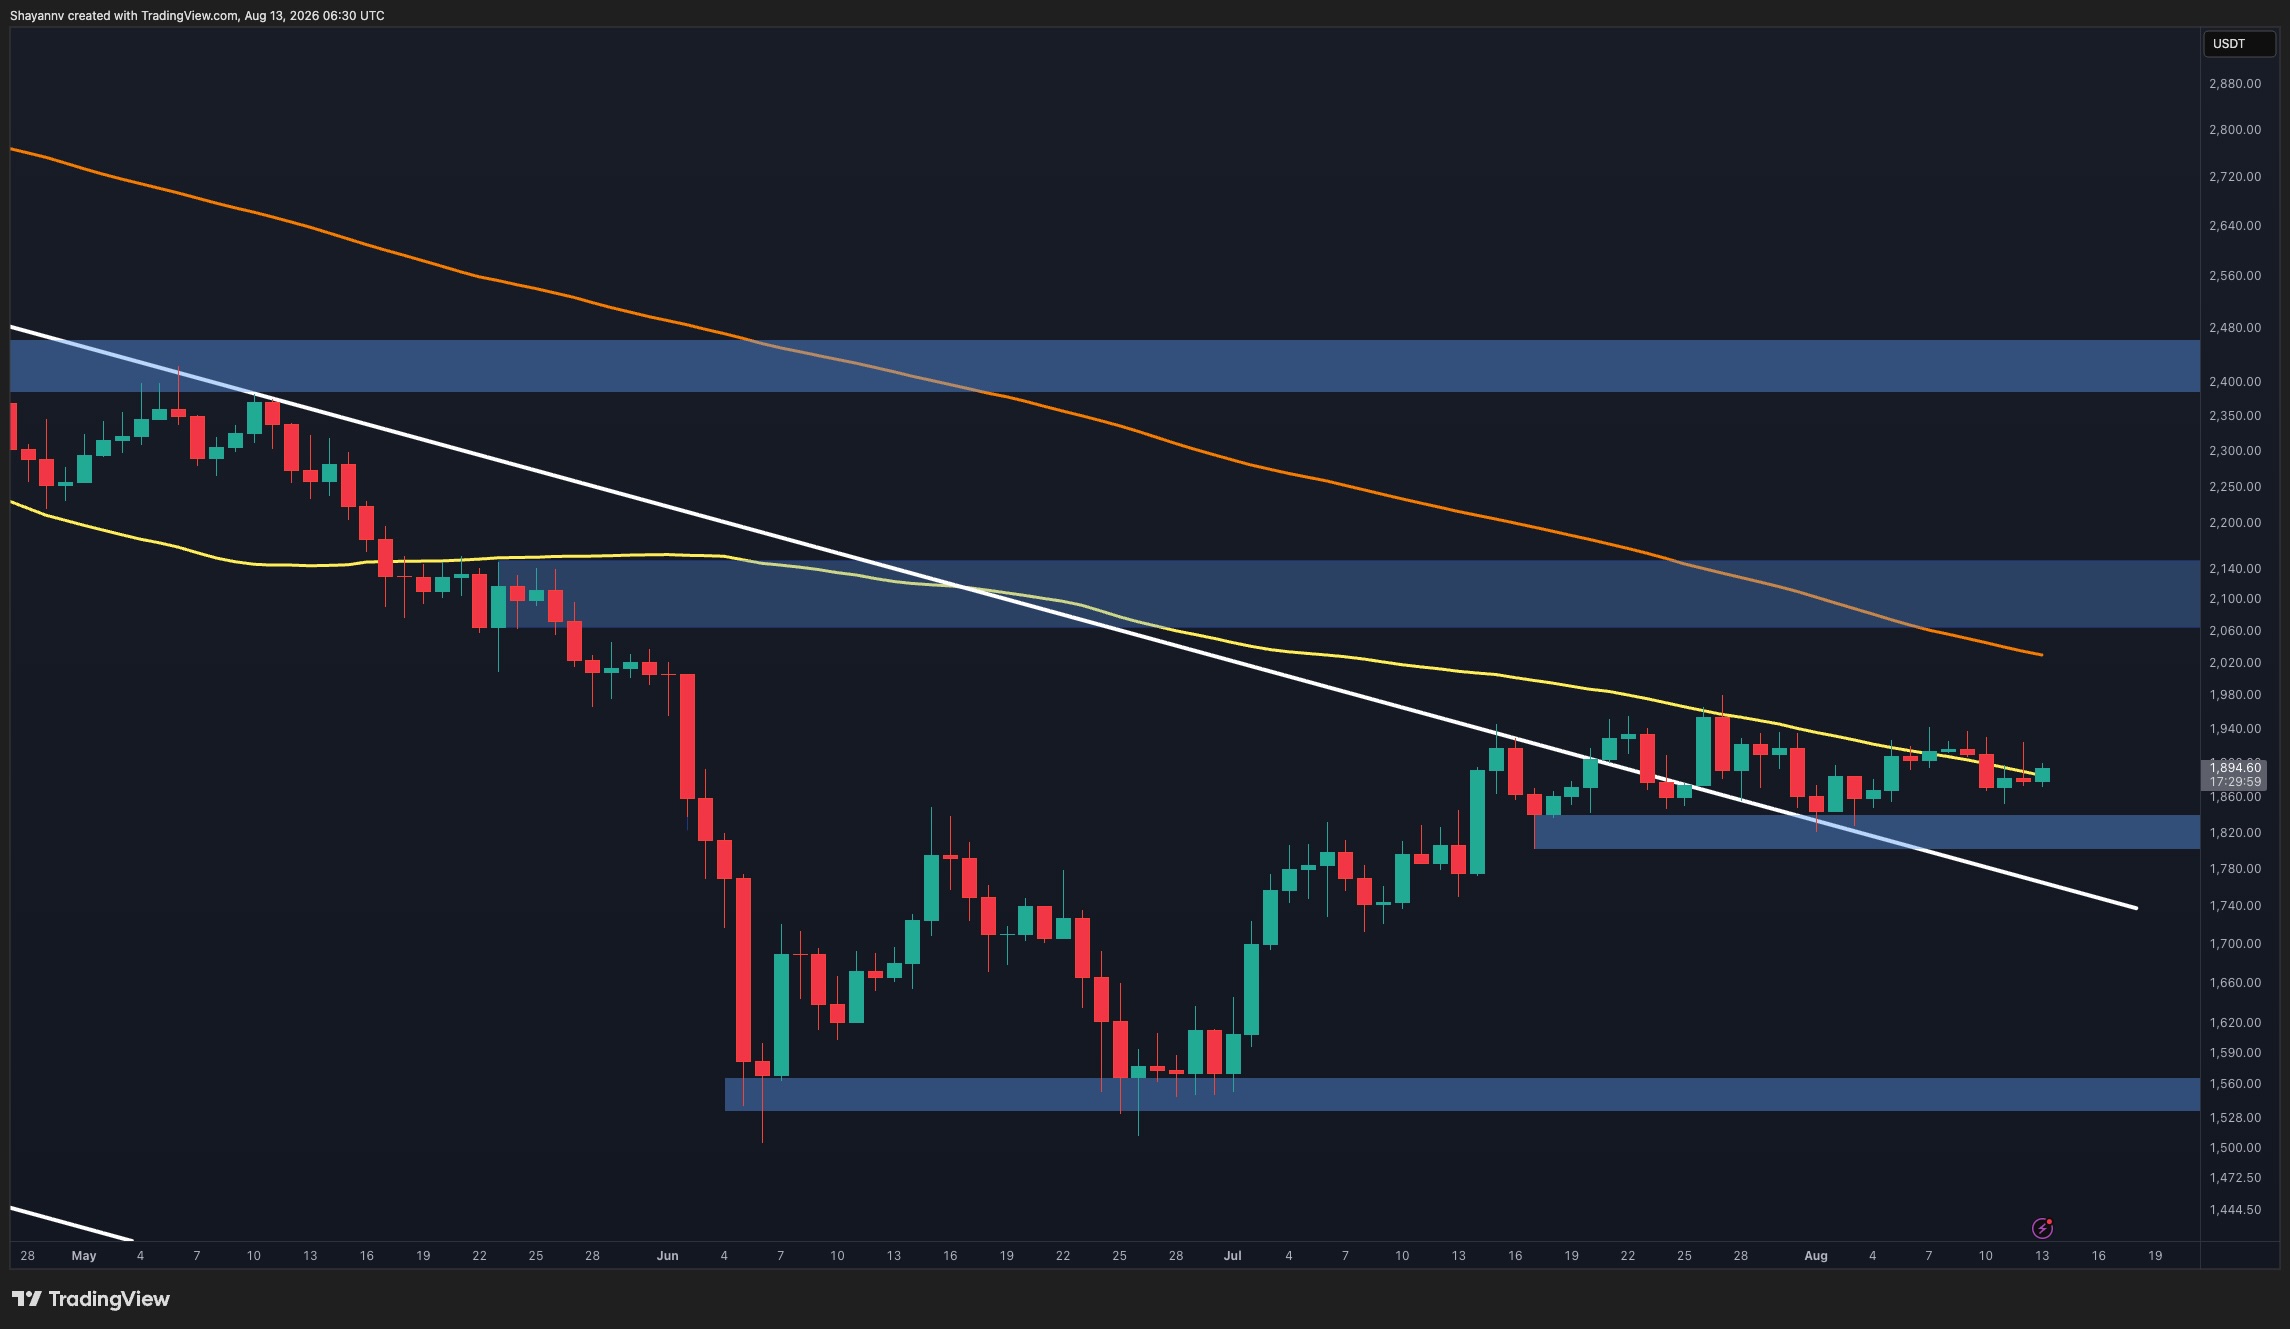
The 4-hour perspective reveals a clearer range. ETH is bouncing between a demand zone of $1.80K-$1.84K and a resistance level of $1.95K-$1.98K, with the current price approximating the center at about $1.89K.
Critically, the ascending trendline beneath the recent price action is holding, functioning as a dynamic support level. The latest downturn briefly tested this trendline around the $1.86K-$1.87K mark before buyers re-entered, maintaining the sequence of higher lows established since the end of June.
Despite this, buyers have faced challenges building up enough momentum to break through the upper resistance. The $1.95K-$1.98K zone has already turned the market back, making it a crucial barrier for future upward movement. A successful breakout here could potentially enable ETH to reach the upper boundary of the broader ascending channel, close to $2K and beyond.
On the flip side, any breach of the ascending trendline would put renewed pressure on the support level of $1.80K-$1.84K. If both levels are lost, it would indicate a significant weakening of short-term structure and could lead to a more extensive correction toward lower support levels.

Market Sentiment Analysis
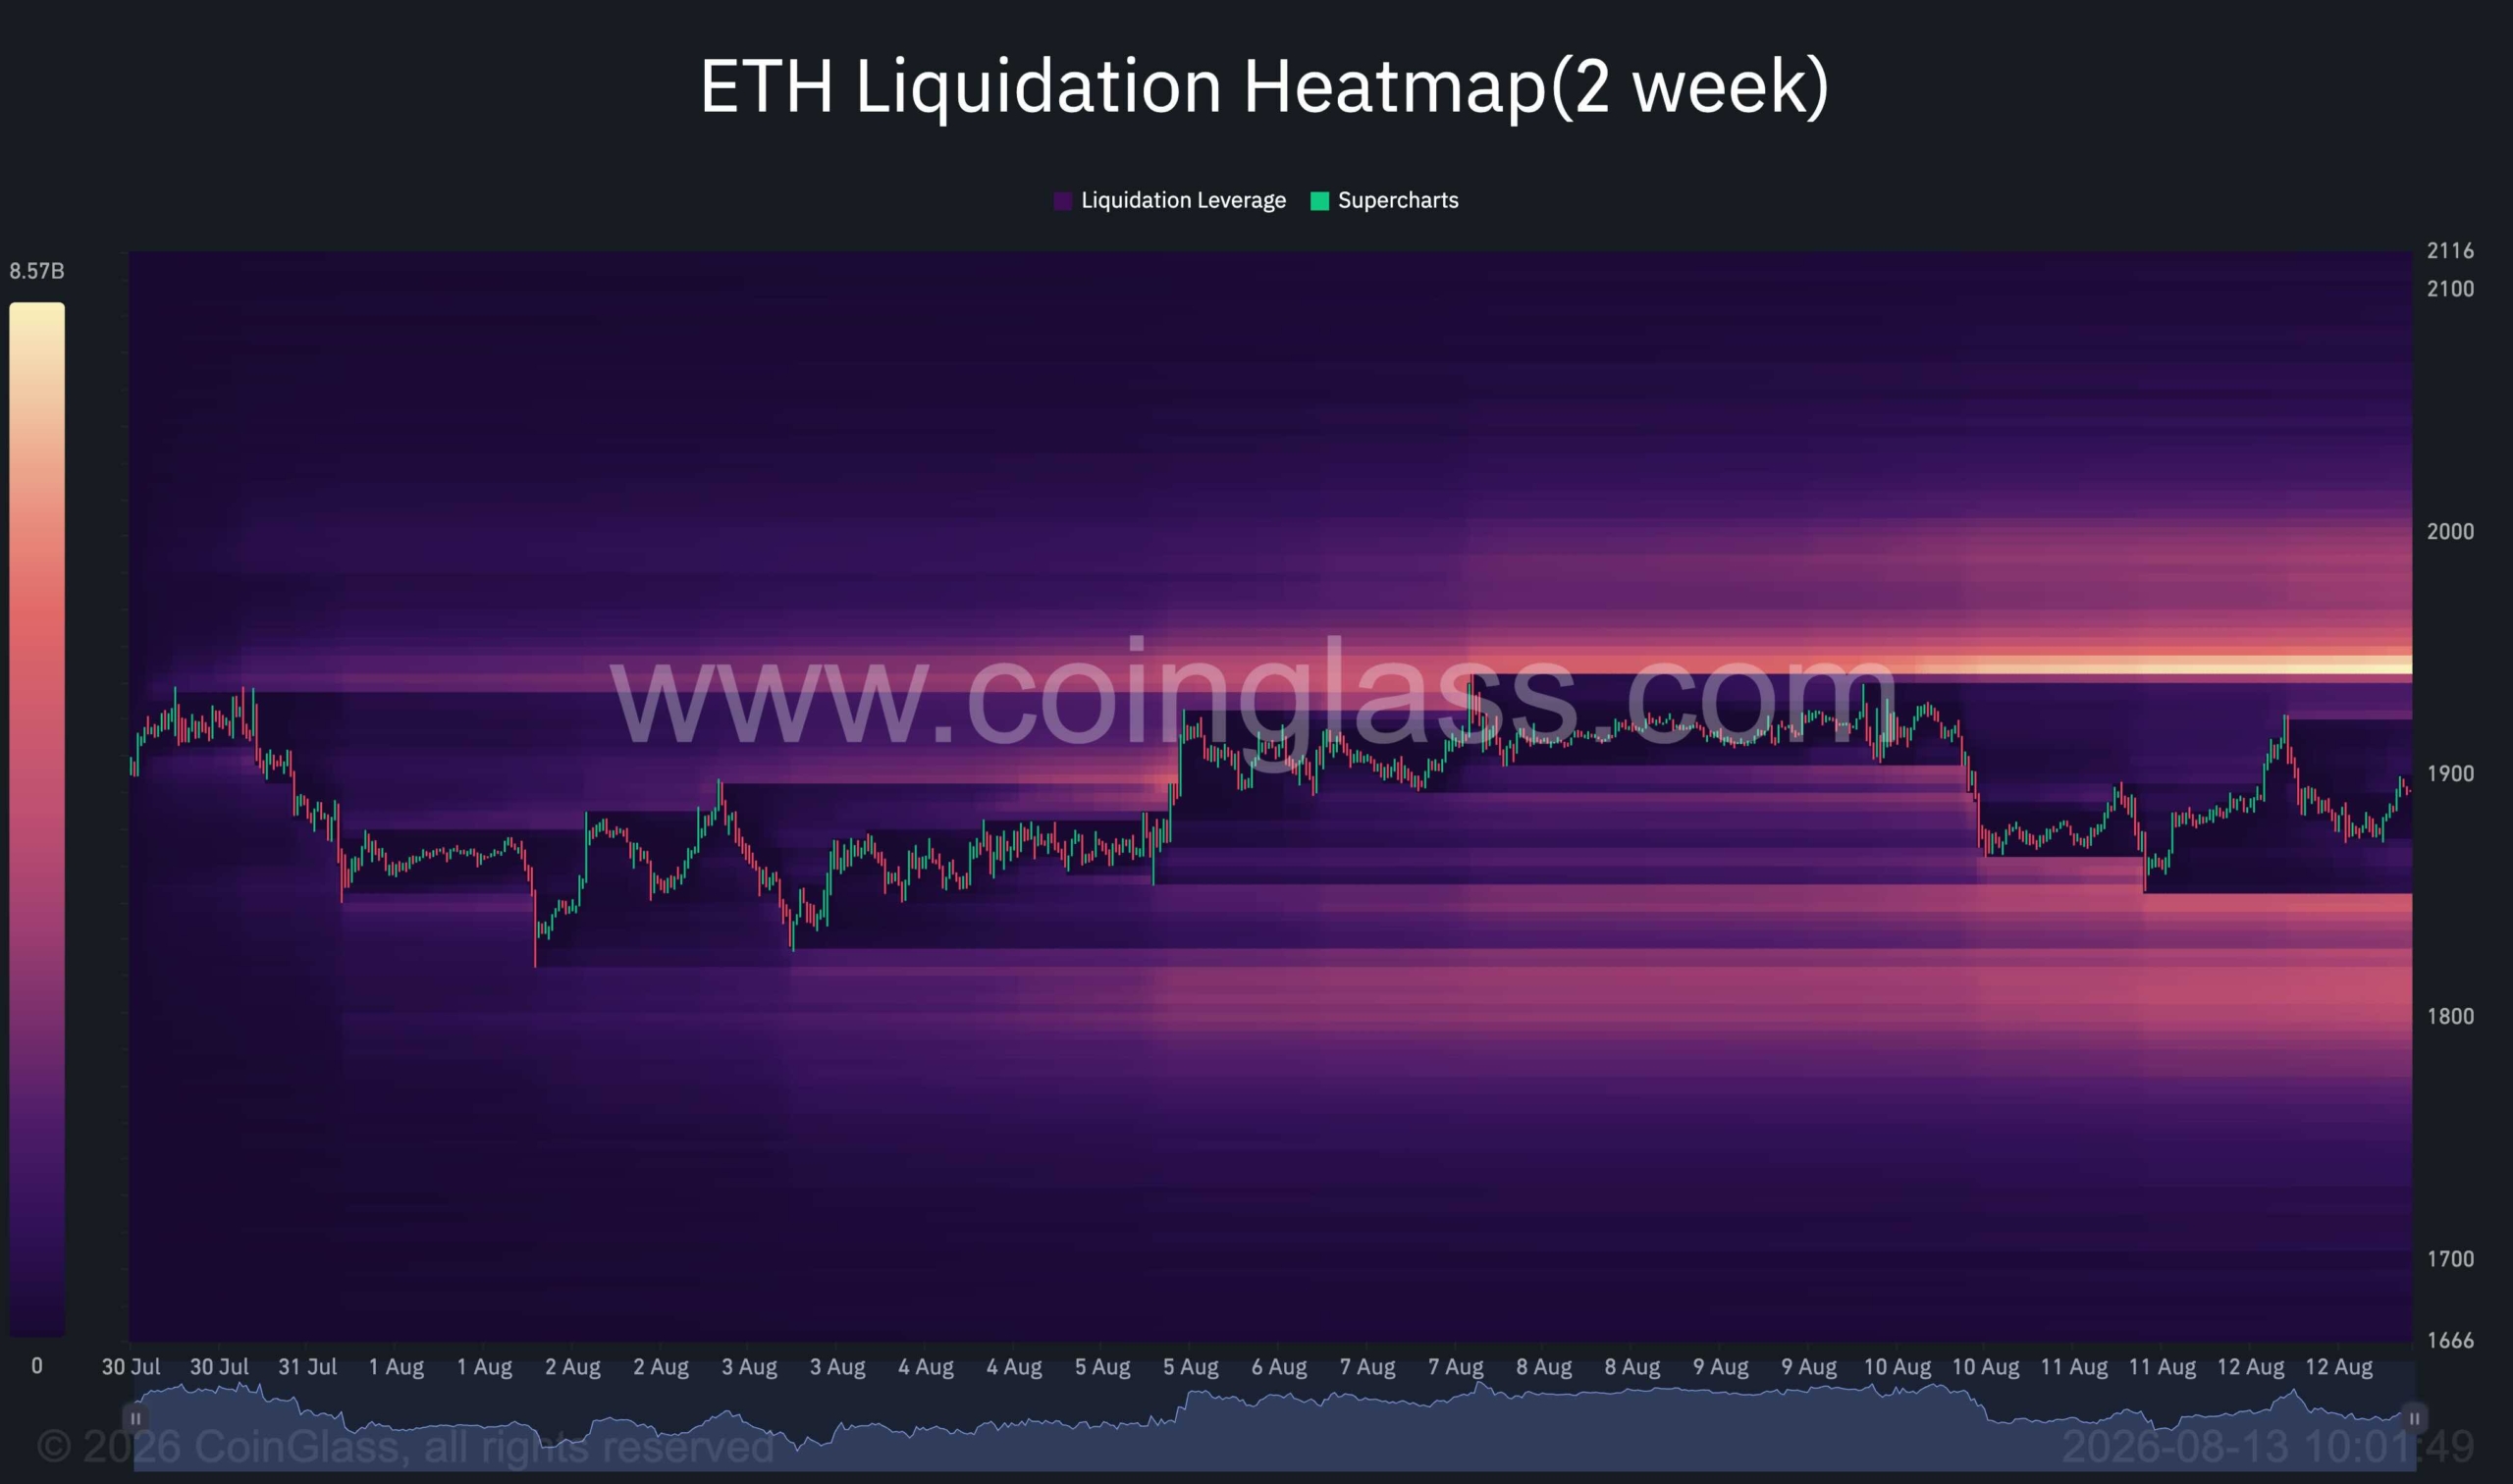
The two-week liquidation heatmap shows the liquidity layout that has emerged during Ethereum’s recent phase of stabilization. With the spot price remaining relatively steady, leveraged positions have built up on both sides of the price range, indicating potential targets for short-term liquidity swings.
The most significant concentration of liquidity appears to be just above the market, around $1.94K-$1.95K, closely matching the technical resistance identified in the 4-hour analysis. This area is particularly critical, as a successful push above recent peaks could initiate short liquidations and likely expedite upward movement.
Additionally, there is minor liquidation liquidity visible beneath the price level, especially near the $1.80K-$1.85K area. This aligns tightly with the demand zone on the 4-hour chart, suggesting that a downside sweep remains a possibility if the ascending trendline fails.
In summary, the heatmap supports the technical framework of a market confined within a range, with liquidity gathering at both extremes. Until Ethereum achieves a definitive breakout, sudden movements in either direction may primarily aim to clear out leveraged positions before the market determines a more stable trend.
Disclaimer: The opinions expressed in this article are those of the authors quoted. They do not reflect the views of CryptoPotato regarding the advisability of any investment. Always conduct your own research before making investment decisions. Use the information provided at your own risk. See Disclaimer for additional details.