

The price of Hedera has dropped roughly 23% from its late September high of about $0.131, currently hovering around $0.101 as traders evaluate if the support level at $0.10 can hold through October.
Overview
- The current price of Hedera sits at $0.101, following a substantial pullback from its late September spike towards $0.131.
- The daily Ichimoku conversion line is positioned at $0.11166, which is above the token’s latest trading price.
- Weekly Supertrend support is recorded at $0.06943, with the Awesome Oscillator now in positive territory.
- According to CoinGlass, there are liquidation concentrations ranging between $0.107 and $0.114, with further levels observed below $0.10.
On TradingView’s chart for HBAR/USDT, Hedera is trading at $0.10120, reflecting a decline of 2.70% during the current session. The token’s trading range has been between $0.10019 and $0.10489, maintaining the most recent drop near the essential support level.
The surge in late September briefly propelled HBAR to approximately $0.131, but a swift reversal has seen it retract back into the low-$0.10 range. This drop translates to an approximate 22.7% decrease, while a recovery to the previous peak would necessitate an increase of about 29.4% from $0.10120.
Daily and weekly charts depict contrasting scenarios. Daily price actions exhibit weaker momentum following the spike, whereas the weekly chart still signals a bullish Supertrend accompanied by positive momentum. Therefore, the chances of recovery in October hinge on whether the nearby support can withstand pressure while HBAR navigates resistance levels above its current position.
Hedera Price Meets Initial Challenge at $0.1117
In TradingView’s daily chart, the Ichimoku conversion line is located at $0.11166, while the baseline is at $0.10146. HBAR is resting just beneath this baseline, about 9.4% away from the conversion line, creating dual challenges for the current price.
A successful recovery above $0.10146 would bring the price back above the baseline. Holding this level amid a following pullback would facilitate an attempt to reach the conversion line, although the considerable gap to $0.11166 indicates the significant challenges buyers face in regaining ground.
The front Ichimoku cloud stretches from approximately $0.09762 to $0.10656. Its lower boundary is below the current price, while the upper edge sits about 5.3% higher, serving as another reference point for a potential October recovery.
While the Ichimoku cloud shifts to positive, HBAR remains beneath the daily conversion line. In a favorable chart scenario, the price would first reclaim the baseline and then move beyond $0.10656 before facing the $0.11166 resistance. Rejection at either higher threshold would indicate an incomplete recovery.
Daily Aroon indicators show Aroon Up at 50% and Aroon Down at 0%. The upward indicator has decreased from its more robust late-September levels, aligning with the growing gap from the recent high, while the downward reading remains low as the longer lookback period hasn’t recorded a fresh low.
Collectively, these daily indicators leave HBAR in a mixed state. Although the price has lost momentum compared to the September surge, the Aroon indicators do not show a dominant new low. Holding steady at $0.10 could support immediate consolidation, while reclaiming $0.11166 would signal a stronger recovery.
Weekly Momentum Gains Below $0.1405 Resistance
On TradingView’s weekly chart, HBAR is reported at $0.10126, with Supertrend support marked at $0.06943. This indicator has turned green after a recent recovery, leaving its support level approximately 31.4% below the latest weekly price.
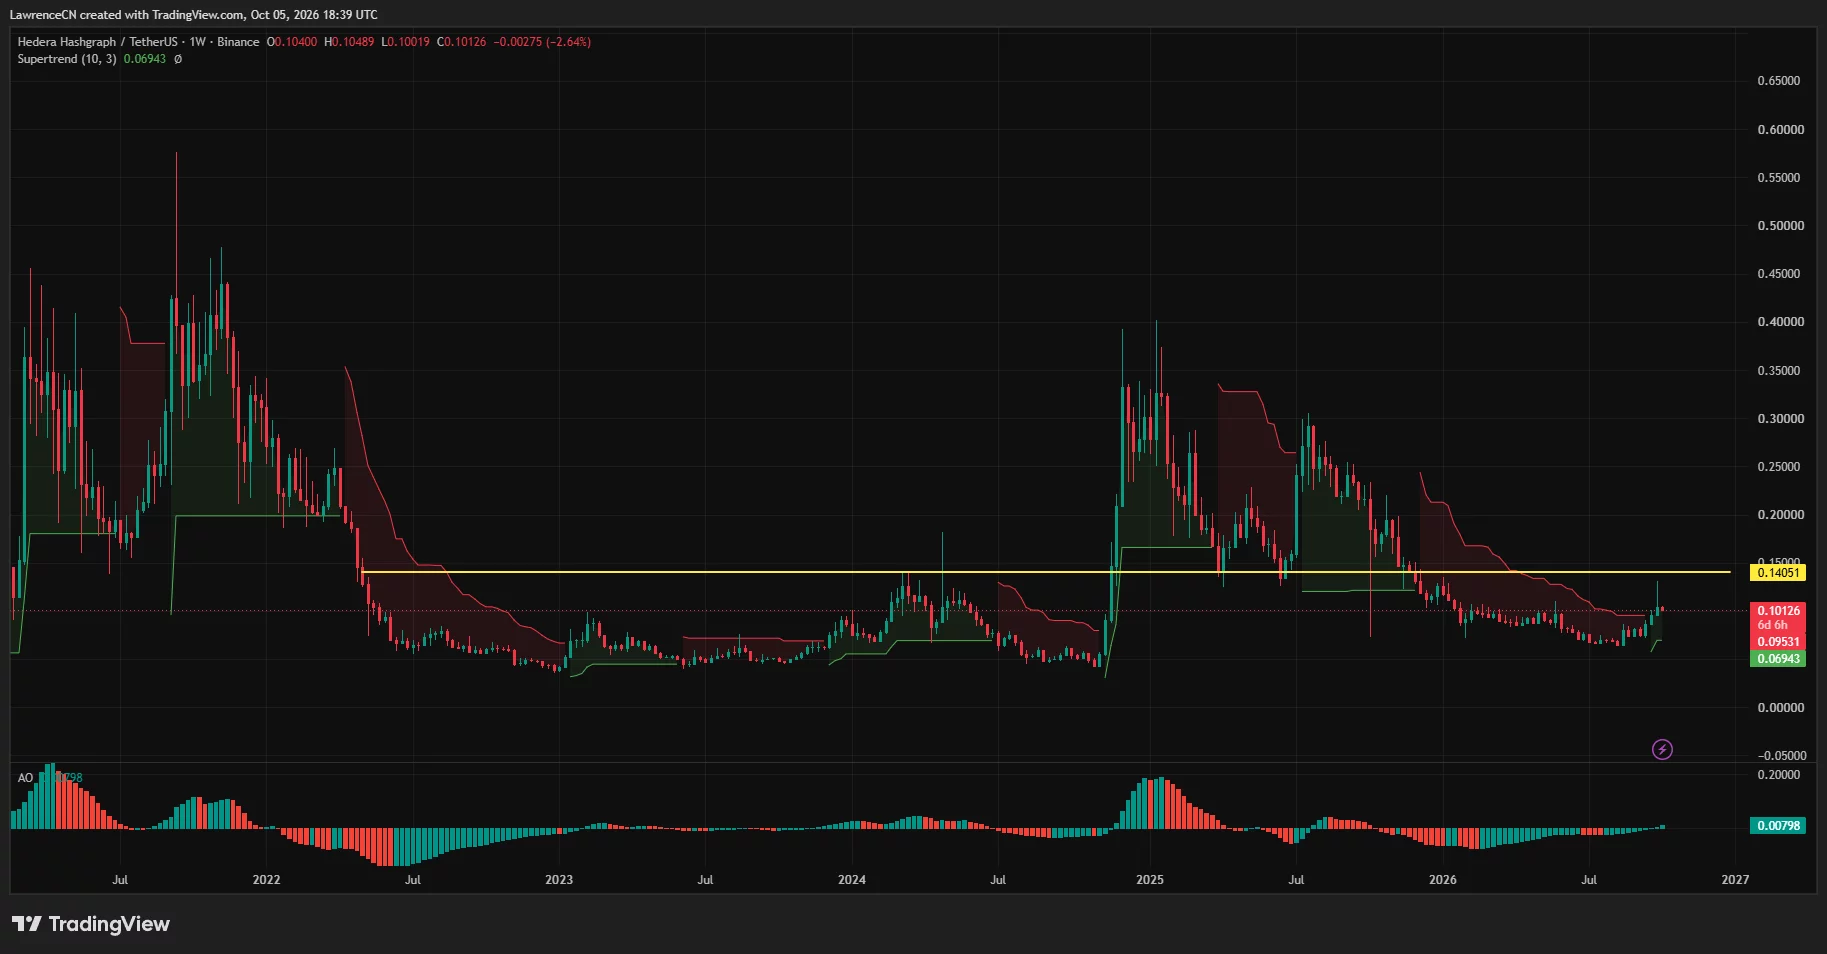
The weekly Awesome Oscillator stands at 0.00798, with green bars showing above zero. Its shift into positive territory marks a significant improvement following a prolonged period of negative readings, lending the weekly recovery a more solid momentum signal than the recent daily downturn implies.
Nevertheless, a significant horizontal resistance at $0.14051 remains well above current market levels. For HBAR to touch this level, it would need an increase of about 38.8% from $0.10126, presenting a considerable recovery target after overcoming intermediate resistance zones.
Past price analysis in the weekly dataset indicates multiple past reactions around the $0.14 mark. A return to this level would bring HBAR back to a price point that was pivotal in earlier market cycles, rather than simply extending the latest recovery into unknown territory.
The late September high of approximately $0.131 sits prior to this weekly resistance. For a bullish October scenario, surpassing $0.11166 would pave the way for aiming for $0.12, followed by the recent peak. Successful breakouts and retention above $0.131 would then focus attention on the marked resistance at $0.14051.
The weekly Supertrend presents a more remote downside reference, while the immediate concern is centered on the $0.10 support. It’s possible for a token to maintain a constructive weekly indicator even with a substantial daily decline, especially when the support line is considerably lower than the current market position.
Giannis Andreou’s Recovery Outlook Requires Support Between $0.085 and $0.10
In a post on X dated October 5, analyst Giannis Andreou has pointed out that the $0.12–$0.15 area will serve as Hedera’s next weekly resistance zone. For his bullish scenario to materialize, he emphasizes the need for the $0.085–$0.10 support region to remain intact during a retest, followed by a sustained recovery above that resistance level.
“In order for my bullish outlook to succeed, support in the $0.085–$0.10 range needs to hold during a retest, followed by a stable reclaim of that resistance.”
Andreou’s support range encompasses the current testing level at $0.10, extending further below. According to his analysis, a brief dip below $0.10 would not necessarily invalidate the broader recovery, provided HBAR reestablishes support within the larger range and subsequently rebounds.
The analyst also identified $0.20 and $0.40 as potential future targets, with the historical peak around $0.576 and $0.60 beyond that. He describes these as part of a full-cycle recovery scenario, with a weekly close under $0.055 thereby invalidating his proposed outlook.
For October, the more immediate expectation centers on the $0.12–$0.15 resistance zone. The higher targets hinge on overcoming several earlier challenges and should not be construed as short-term forecasts.
Liquidation Bands Set the Next Movement Near $0.10
CoinGlass’s one-month liquidation heatmap for HBAR indicates several overhead concentrations between $0.107 and $0.114. Additional bands emerge around $0.12–$0.125 and near $0.132, which align with price levels HBAR would encounter on its journey back to its September peak.
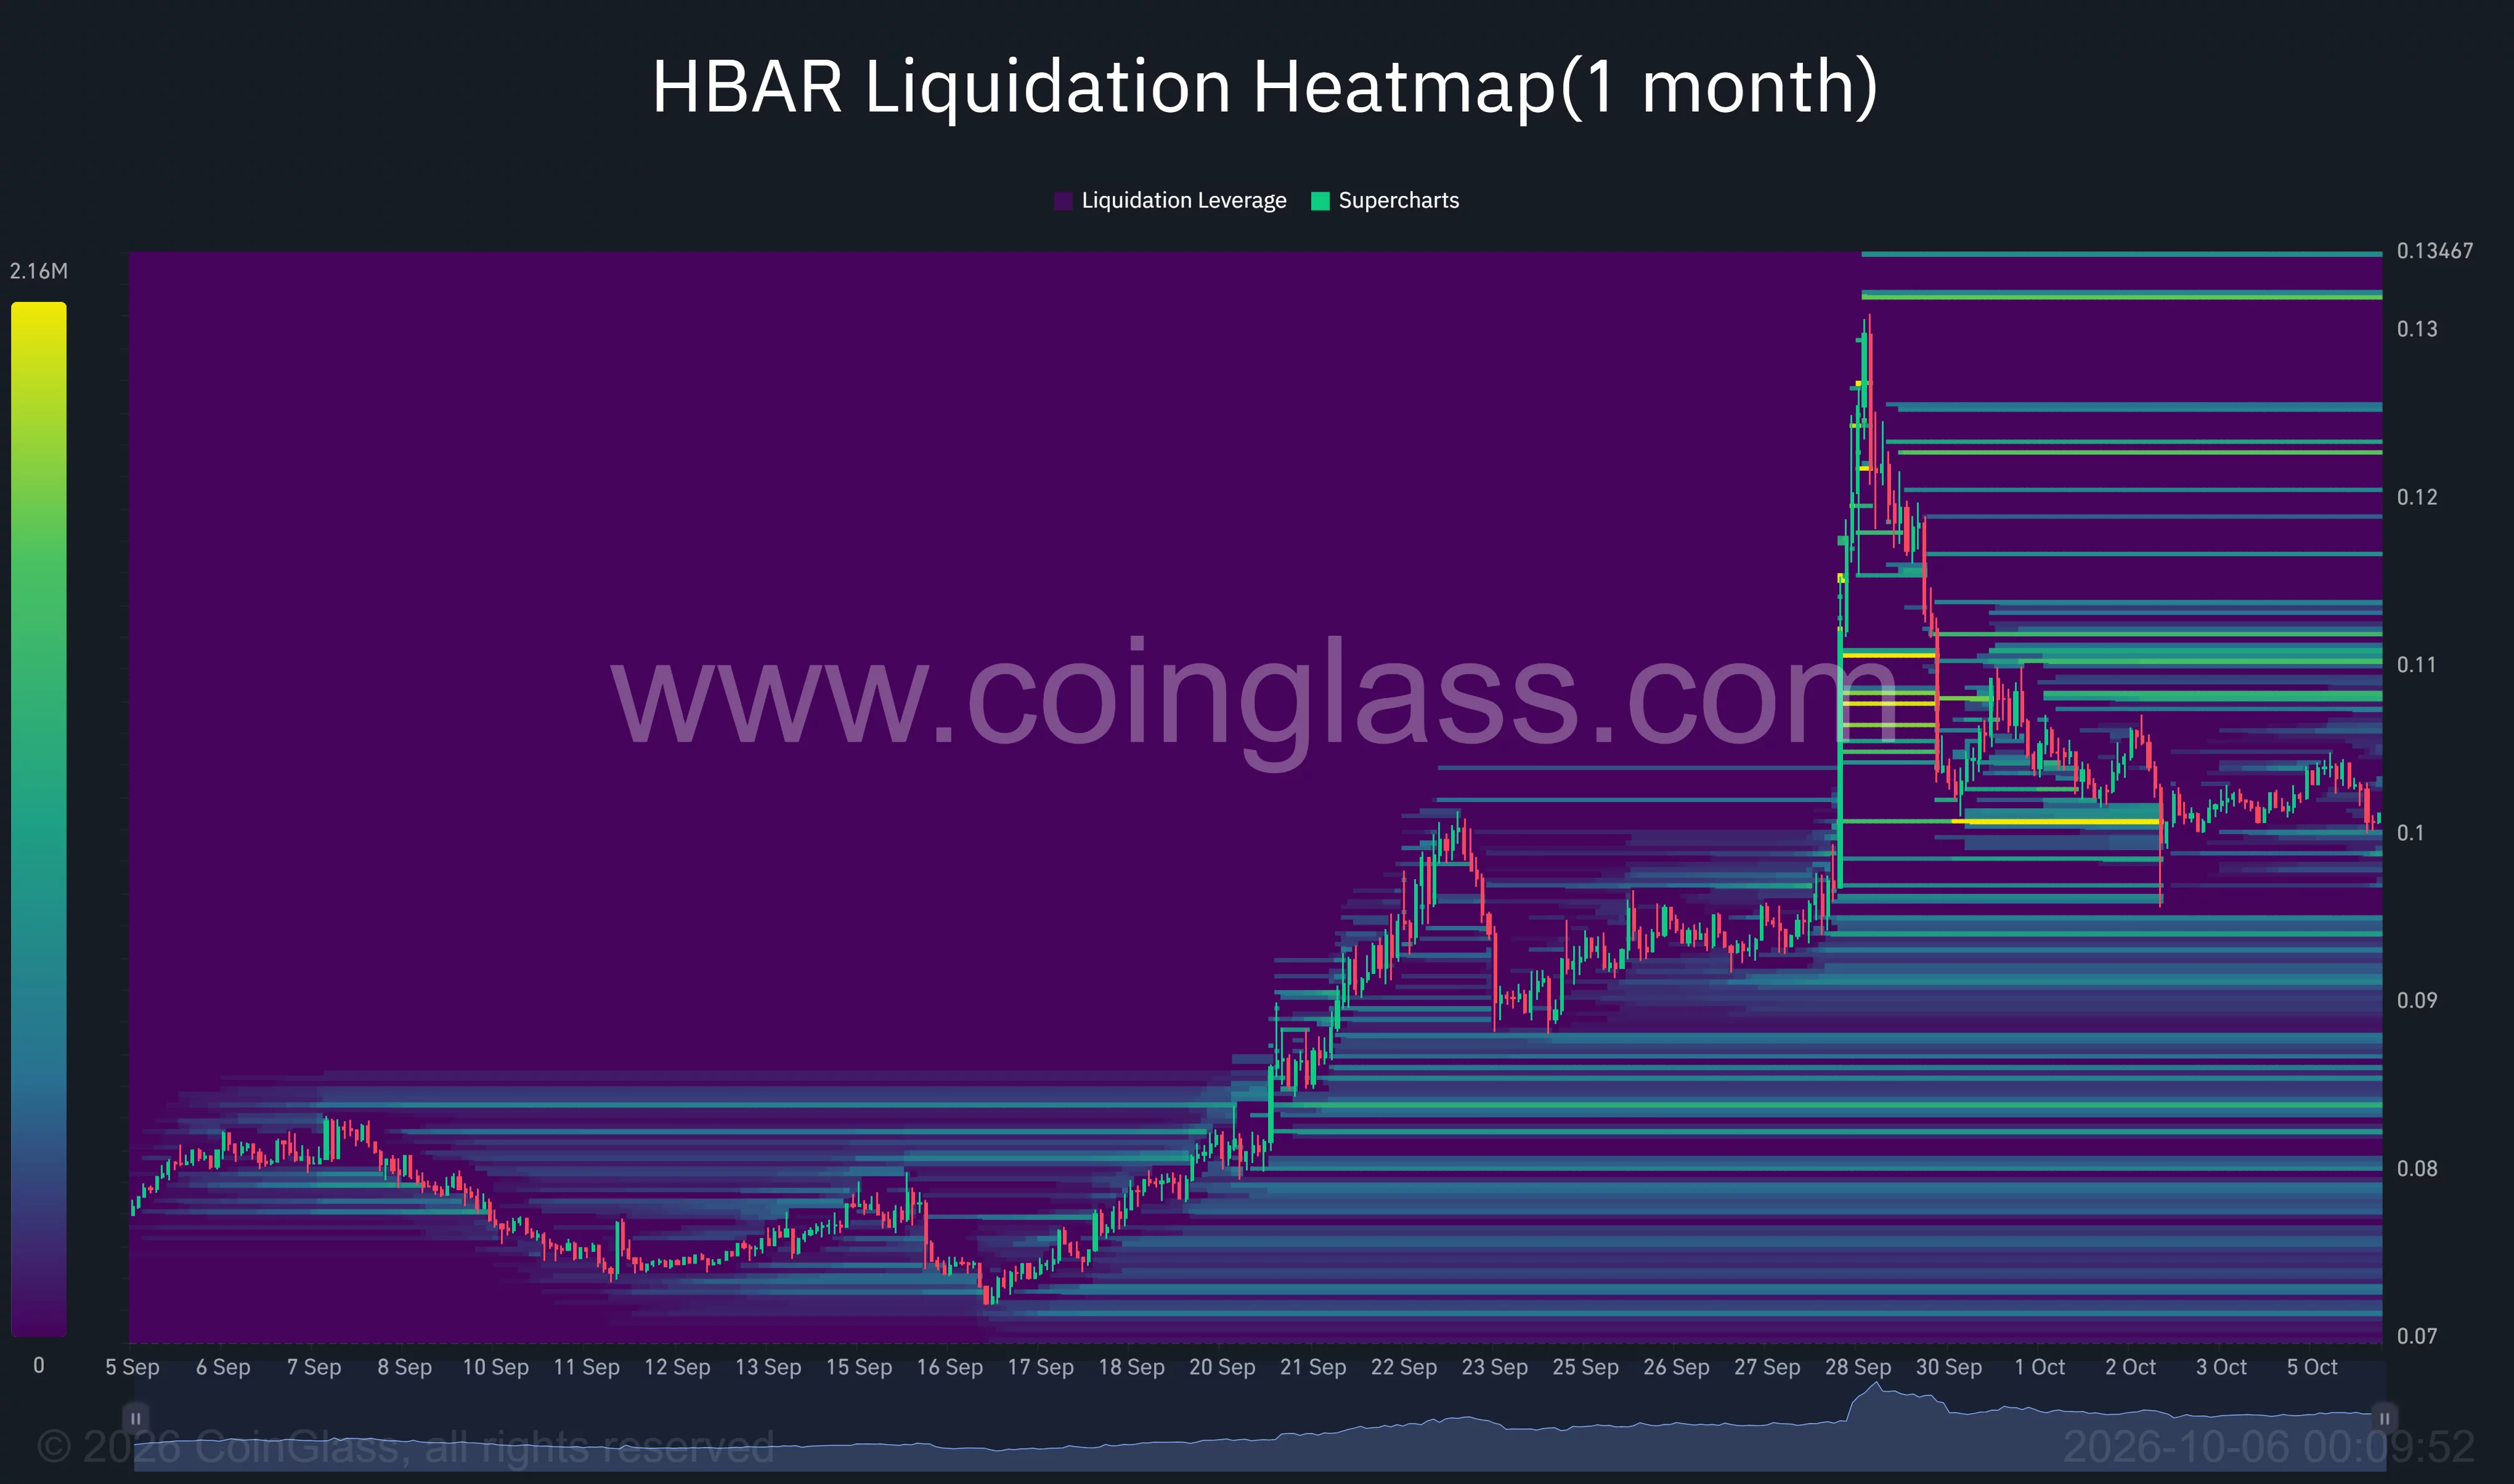
Beneath the current price, the heatmap reveals concentrations at around $0.098, with additional bands at $0.094–$0.095 and $0.091–$0.092. Higher bands exist in the low-$0.08 range, providing reference points should the ongoing support test falter.
Should the immediate bearish scenario unfold, it would initiate with a sustained drop below $0.10, followed by an inability to recover. A decrease past the Ichimoku cloud’s lower boundary of $0.09762 would turn attention towards the $0.094–$0.095 area, where there’s overlap from September’s price consolidation and liquidation bands.
Failure to maintain this region would expose the next significant level around $0.09. Andreou’s lower support threshold of $0.085 would become increasingly relevant if a more considerable correction occurs, before the more distant weekly Supertrend level at $0.06943 comes into play.
IBM Developments Add Context as October Resistance Emerges
The Hashgraph Group revealed on September 23 that its Hedera-based IDTrust identity platform has received validation and is now featured in the IBM Cloud Catalog. This platform is described as a digital identity solution that supports verifiable identities for AI agents.
Additionally, on September 28, IBM announced that IBM Agent Identity and HashiCorp Vault are integrated with NVIDIA OpenShell, identifying these tools as part of its initiatives related to NVIDIA’s Open Agent Safety Platform.
For U.S. investors, Nasdaq’s listing notice confirmed that the Canary HBAR ETF started trading under the ticker HBR on October 28, 2025. This listing opens a route for investors to gain HBAR exposure on the U.S. exchange in addition to direct token ownership.
The technical outlook for October focuses on the support at $0.10 and the daily conversion line at $0.11166. Maintaining support while clearing this line strengthens the case for reaching the $0.12–$0.131 range. Conversely, a sustained breach below $0.09762 would draw attention to the $0.095 and $0.09 levels.
Disclosure: This article is not intended as investment advice. The information and materials included on this page are solely for educational purposes.