

Key Takeaways
- XRP surpasses its previous peak from 2018, entering uncharted price territory amid strong market activity.
- Dogecoin hovers around $0.20, with technical indicators suggesting a potential turning point.
- Ethereum’s long-term positive trend remains intact, but faces a crucial test as it approaches its all-time high.
The cryptocurrency market has seen significant activity lately, particularly in alternative cryptocurrencies. Investors are watching Dogecoin with interest, Ethereum supporters are optimistic, and XRP is experiencing a surge in buying pressure.
What’s next for these digital currencies? Their respective performance provides unique insights. But first, a broader perspective:
The cryptocurrency market is currently operating within a complex global financial landscape, where established markets are achieving new records while geopolitical issues persist. The overall value of the crypto market briefly exceeded $4 trillion earlier today, marking a historical milestone. Simultaneously, global stock markets are showing optimism, with the S&P 500 nearing 6,230 and the tech-focused Nasdaq approaching 20,900 points.
The general risk-taking appetite in traditional markets often supports the cryptocurrency sector, though the connection is not always immediate. The Federal Reserve’s decision to maintain current interest rates at 4.25%-4.5% has led to a cautious market stance, adhering to its stated policy that “economic uncertainty remains elevated.”
Against this backdrop, Bitcoin’s recent climb to new all-time highs has created varied opportunities for other major cryptocurrencies. Bitcoin’s surge was fueled by significant investments in ETFs, reaching $1.18 billion in a single day last week. However, the rising tide hasn’t lifted all boats equally, with weekly analysis showing diverse technical scenarios for XRP, Dogecoin, and Ethereum.
XRP Price Analysis: Where To Next After Record Highs?
XRP has finally achieved a long-awaited milestone, surpassing its 2018 peak of $3.40 to reach $3.66. Analyzing the weekly chart, which provides a long-term view by minimizing short-term fluctuations, XRP’s technical structure appears robust, suggesting potential for further gains.
The weekly Relative Strength Index (RSI), currently at 70, is at the overbought threshold, typically signaling caution for short-term traders but indicating strength in longer-term trends. Historically, weekly RSI readings above 70 have marked the start of sustained bullish trends rather than immediate price reversals. Assets can remain in “overbought” territory for extended periods during strong uptrends, making this a positive signal for patient investors.
The Average Directional Index (ADX) for XRP currently stands at 19 on the weekly chart, which might seem contradictory. The ADX measures the strength of a trend, regardless of its direction, on a scale of 0 to 100. Readings below 25 usually suggest weak trends; however, context is important. On weekly charts, after breakouts from long-term consolidation periods, a low ADX often indicates that the primary trend is just beginning. Given XRP’s prolonged sideways movement, this low ADX reading is expected.
The configuration of moving averages on the weekly chart presents a very encouraging outlook. The 50-week EMA (representing the average price over the past year) is significantly below current levels, and the gap between it and the 200-week EMA continues to widen. This increasing distance typically precedes long-lasting trending moves, reflecting consistent accumulation and limited profit-taking in the short term.
Fibonacci extension levels, which are used to project potential resistance during periods of price discovery, suggest possible resistance at $4.3 and higher. However, during genuine price discovery phases, these levels often act as psychological milestones rather than strict barriers.
Key Levels (Weekly View):
- Immediate Support: $3.00 (a psychological level confirming the recent breakout)
- Strong Support: $2.50 (previous resistance over multiple months)
- Immediate Resistance: $4.00 (round number, psychologically significant)
- Strong Resistance: $4.38 (confluence of Fibonacci extension levels)
Dogecoin Price Analysis: Ready for a Breakout?
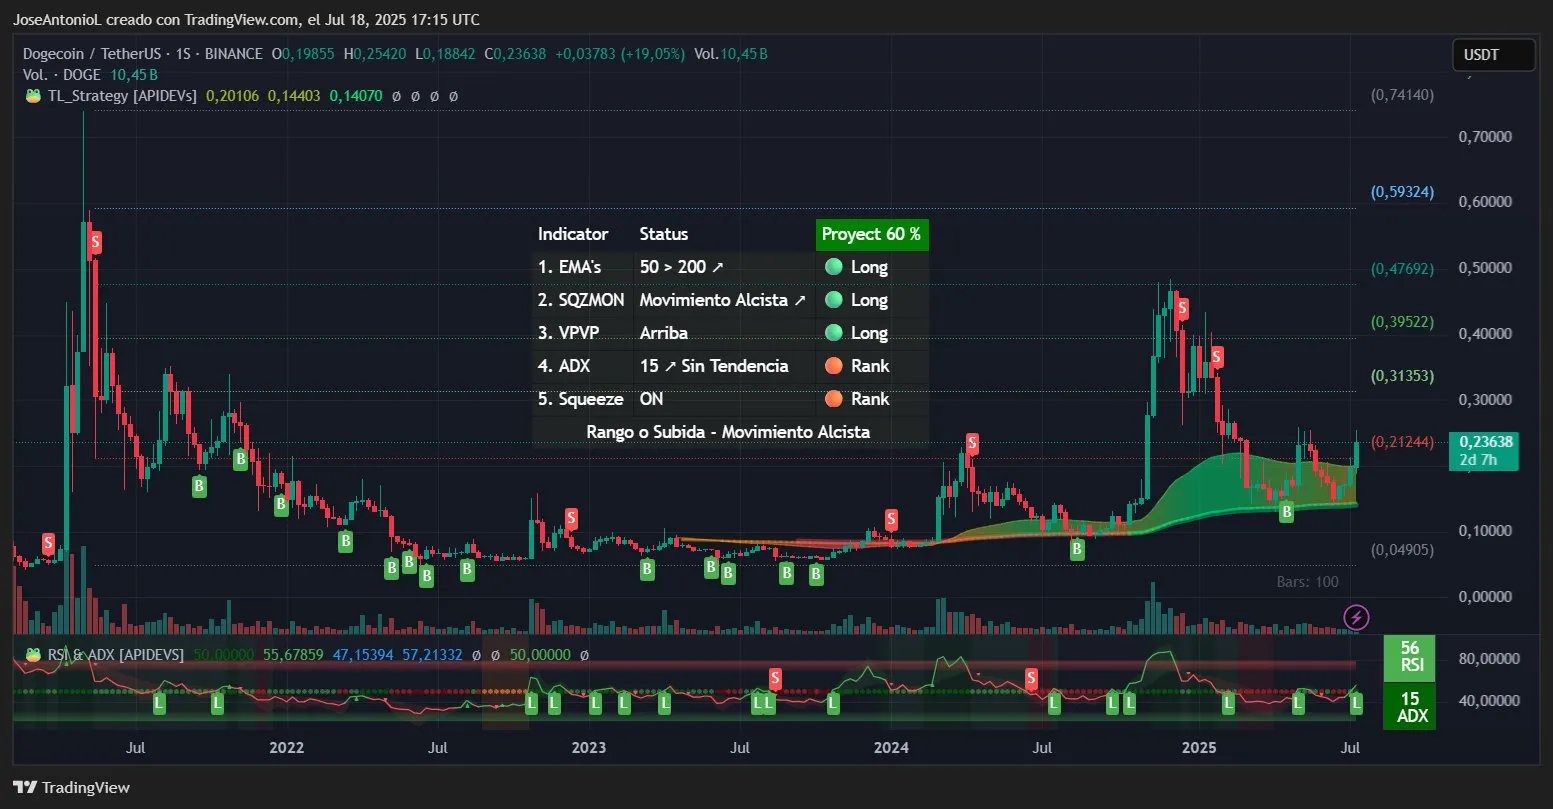
Dogecoin’s weekly chart indicates a critical phase of consolidation, currently trading at $0.20 after a significant recovery from its 2024 lows. DOGE appears to be establishing a base on the weekly chart, which could support a substantial move in either direction, testing an important resistance point.
The weekly RSI, at 56, indicates a neutral market position. Unlike daily RSI, which often fluctuates wildly, a weekly RSI of 56 suggests that the market has absorbed recent gains and is awaiting the next catalyst. This situation offers position traders a potential opportunity to accumulate before the next trend emerges, with an acceptable risk-reward ratio relative to crypto standards (30% potential downside vs. 90% potential upside).
An ADX of 15 on the weekly chart confirms the consolidation suggested by the price action. Weekly ADX values below 20 typically indicate a phase of accumulation lasting weeks to months. These “no trend” periods often precede explosive moves, representing peak uncertainty and, therefore, maximum opportunity when a direction is finally established.
Dogecoin’s position relative to its weekly moving averages provides crucial context. Trading above the 50-week EMA sustains the long-term uptrend structure, but the convergence of the 50 and 200-week EMAs (the gap between the two is narrowing) suggests some market hesitation regarding DOGE’s ability to maintain bullish momentum over the long term.
Key Levels (Weekly View):
- Immediate Support: $0.18 (50-week EMA zone)
- Strong Support: $0.15 (multi-month accumulation base)
- Immediate Resistance: $0.24 (recent weekly high)
- Strong Resistance: $0.31 (Fibonacci level)
Ethereum Price Analysis: A Battleground for Bulls and Bears
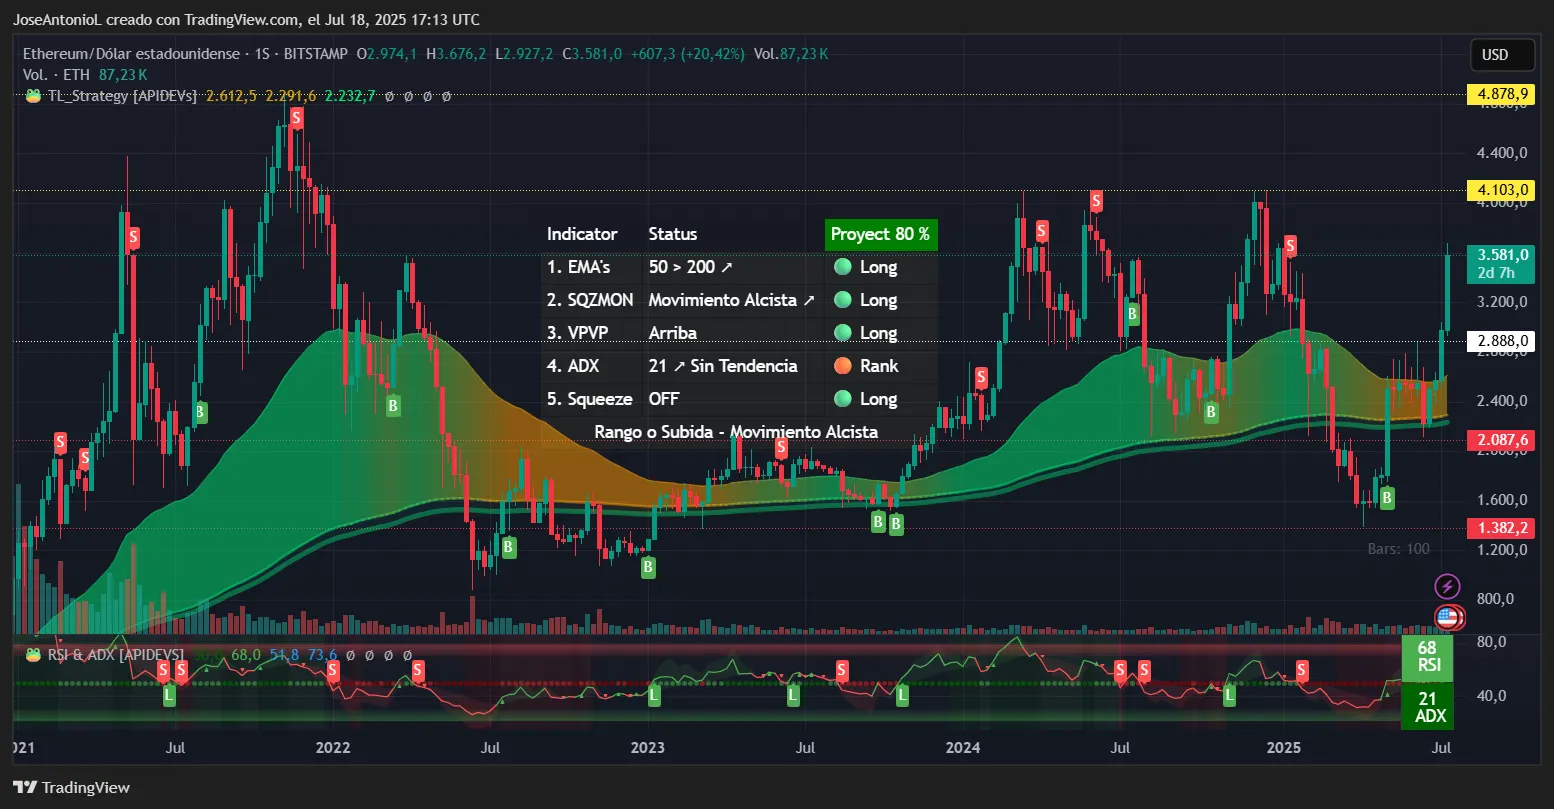
Ethereum’s weekly chart presents a more complex scenario. Currently valued at $3,581, ETH is in a tug-of-war between a well-established long-term uptrend and key resistance levels that have capped gains throughout 2024 and early 2025.
The weekly RSI of 68 is approaching, but has not yet reached, the overbought level of 70, suggesting potential for further upside if buying interest continues. In weekly charts, RSI values between 60 and 70 often represent the optimal zone for sustained trends, indicating sufficient momentum without being overextended enough to trigger immediate profit-taking. This setup favors long-term investors in the coming months.
The weekly ADX, at 21, is just crossing the threshold for confirming a trend. While not particularly strong, crossing above 20 on the weekly ADX often signals a transition from consolidation to a trending phase. For position traders, this suggests that ETH may be in the early stages of its next major move, though this needs further confirmation.
Looking at the charts, ETH has failed to decisively break past the $4,000 mark during previous attempts. Therefore, ETH traders might see additional gains before taking profits, as they assess whether the bullish trend has enough steam to continue.
The key battlegrounds on the weekly chart are the yellow resistance zones, clearly marked at $2,888 and $3,580. These areas represent previous points of significant selling pressure, creating overhead supply that the market must overcome. The red support lines at $2,087 and $1,382 represent the foundations of the current market structure.