

On September 4, XRP’s price hovered around $1.45 after surpassing a declining 4-hour channel, but buyers now face resistance in the $1.50 to $1.53 range.
Summary
- The XRP price has moved past a downward-sloping 4-hour channel after bouncing off support around $1.33.
- The daily RSI reads 66.22, indicating strong momentum without hitting the overbought threshold of 70.
- Liquidation levels are located near $1.43 below the current price and between $1.48 and $1.53 above it.
- The upcoming vote on the CLARITY Act on September 15 and inflation data from the U.S. could dictate future movements.
Current XRP Market Activity
As reported by crypto.news, XRP (XRP) traded close to $1.45 on Friday, stabilizing after a significant rebound from its early September low of around $1.33.
During its ascent, the token briefly peaked at about $1.47 before losing momentum. However, the pullback has been minor in comparison to the preceding breakout.
The 4-hour chart for XRP indicates a rise above the upper limit of a bearish channel that had dominated the market since a rally on August 22. This downward channel emerged after XRP peaked at nearly $1.70, subsequently forming lower highs and lower lows.
The breakout initiated around $1.37, leading to a swift rise above $1.45. XRP is currently positioned above the previous channel resistance, maintaining a bullish outlook as long as that level is upheld.
The Awesome Oscillator currently sits at 0.0669, consistently generating positive bars. This measurement suggests that short-term momentum is still stronger than long-term momentum, although the most recent bars indicate a slight deceleration in initial acceleration.
Meanwhile, the Average Directional Index (ADX) has risen to 26.88. An ADX reading exceeding 25 generally indicates a developing trend, reinforcing the significance of the channel breakout over weaker conditions.
Facing Resistance at $1.50 and $1.53
The primary obstacle is located in the $1.48 to $1.50 range, where XRP has had difficulty maintaining gains post-August rally. A firm close above this range could empower buyers to take on the upper area of the descending channel around $1.55.
The daily chart suggests further resistance at $1.53. Analyst ChartNerd has identified this level as XRP’s 50-week exponential moving average (EMA), contrasting with the 20-week EMA, which is notably lower at nearly $1.28.
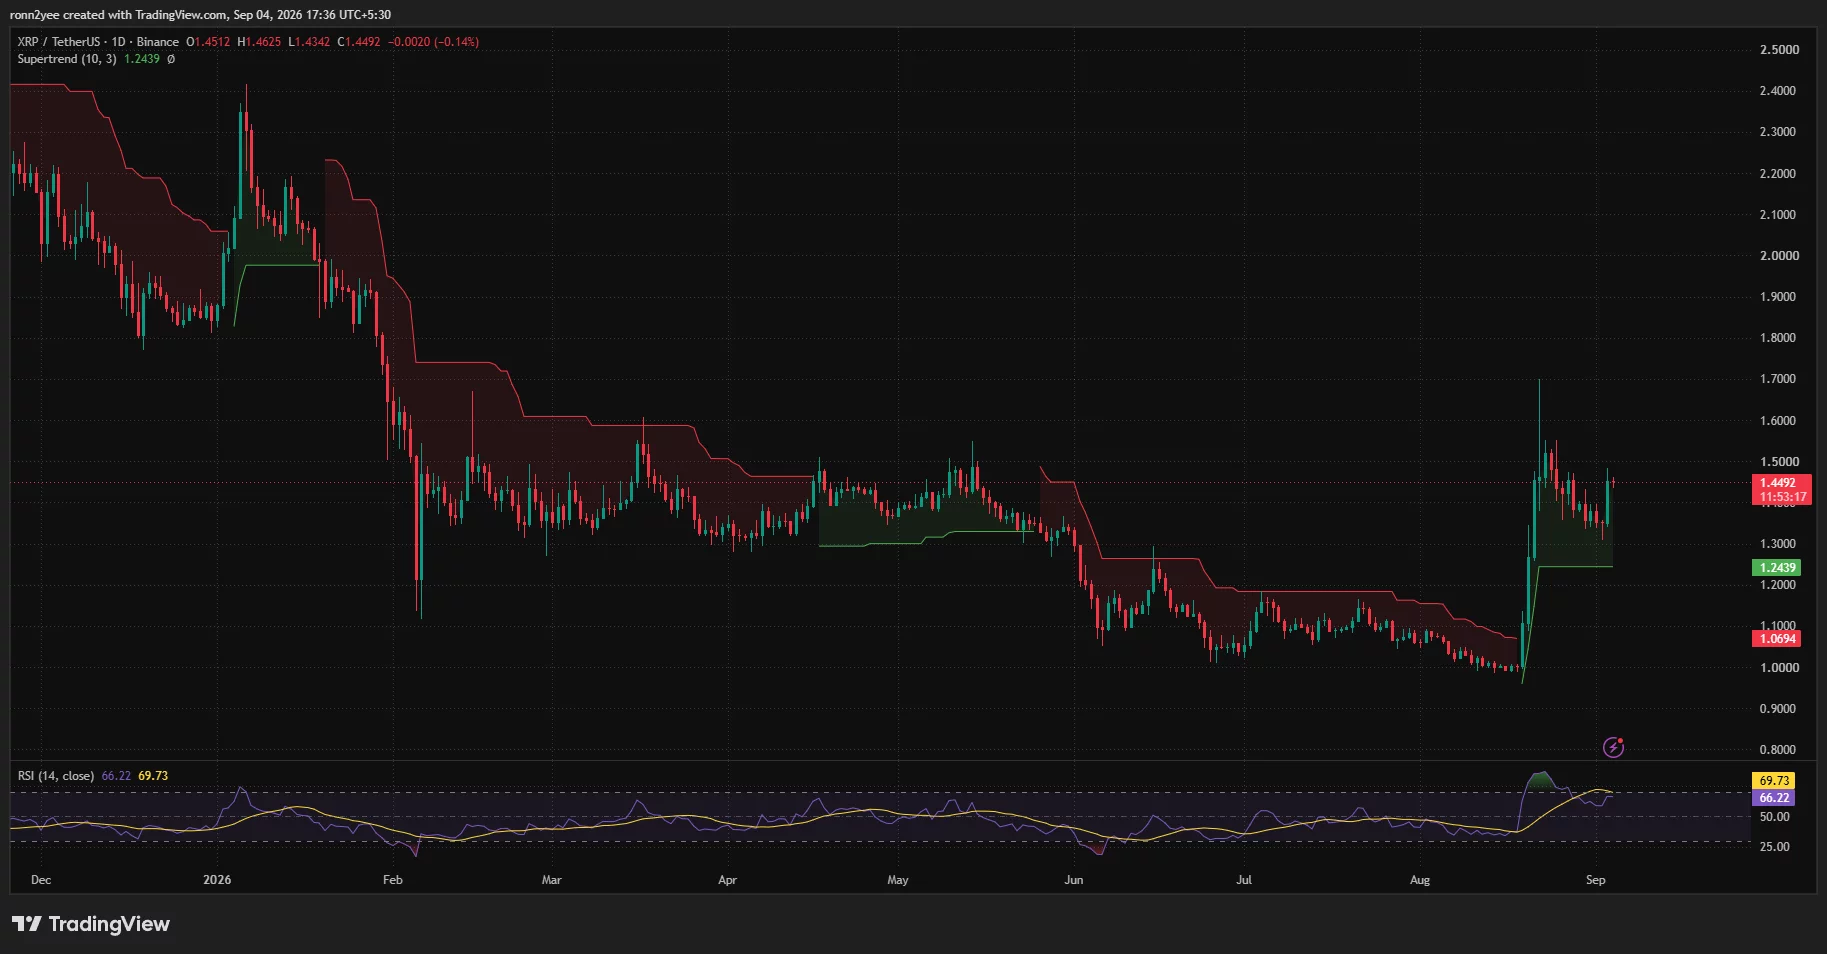
ChartNerd noted that XRP is situated in a broad weekly compression range between the two EMAs. The analyst mentioned that a strong move above the 50-week EMA could lead toward $1.80, while consistent weekly closes below it may increase the chances of a deeper market pullback.
Current daily momentum indicates potential for another test of resistance, but traders should exercise caution. The 14-day Relative Strength Index for XRP is at 66.22, below its signal average of 69.73 and just shy of the typical overbought threshold of 70.
This reading suggests that buyers are still in control of the overall trend, although momentum has weakened since XRP approached $1.70. A rise above 70, paired with a close over $1.53, would offer more robust confirmation of a sustained recovery.
Liquidation Map Highlights $1.43 Support
The three-day XRP liquidation heatmap from CoinGlass indicates that the nearest concentration of leveraged positions is around $1.425 to $1.435. This liquidity is just below the current market price and could attract a quick sweep if XRP is unable to maintain above $1.45.
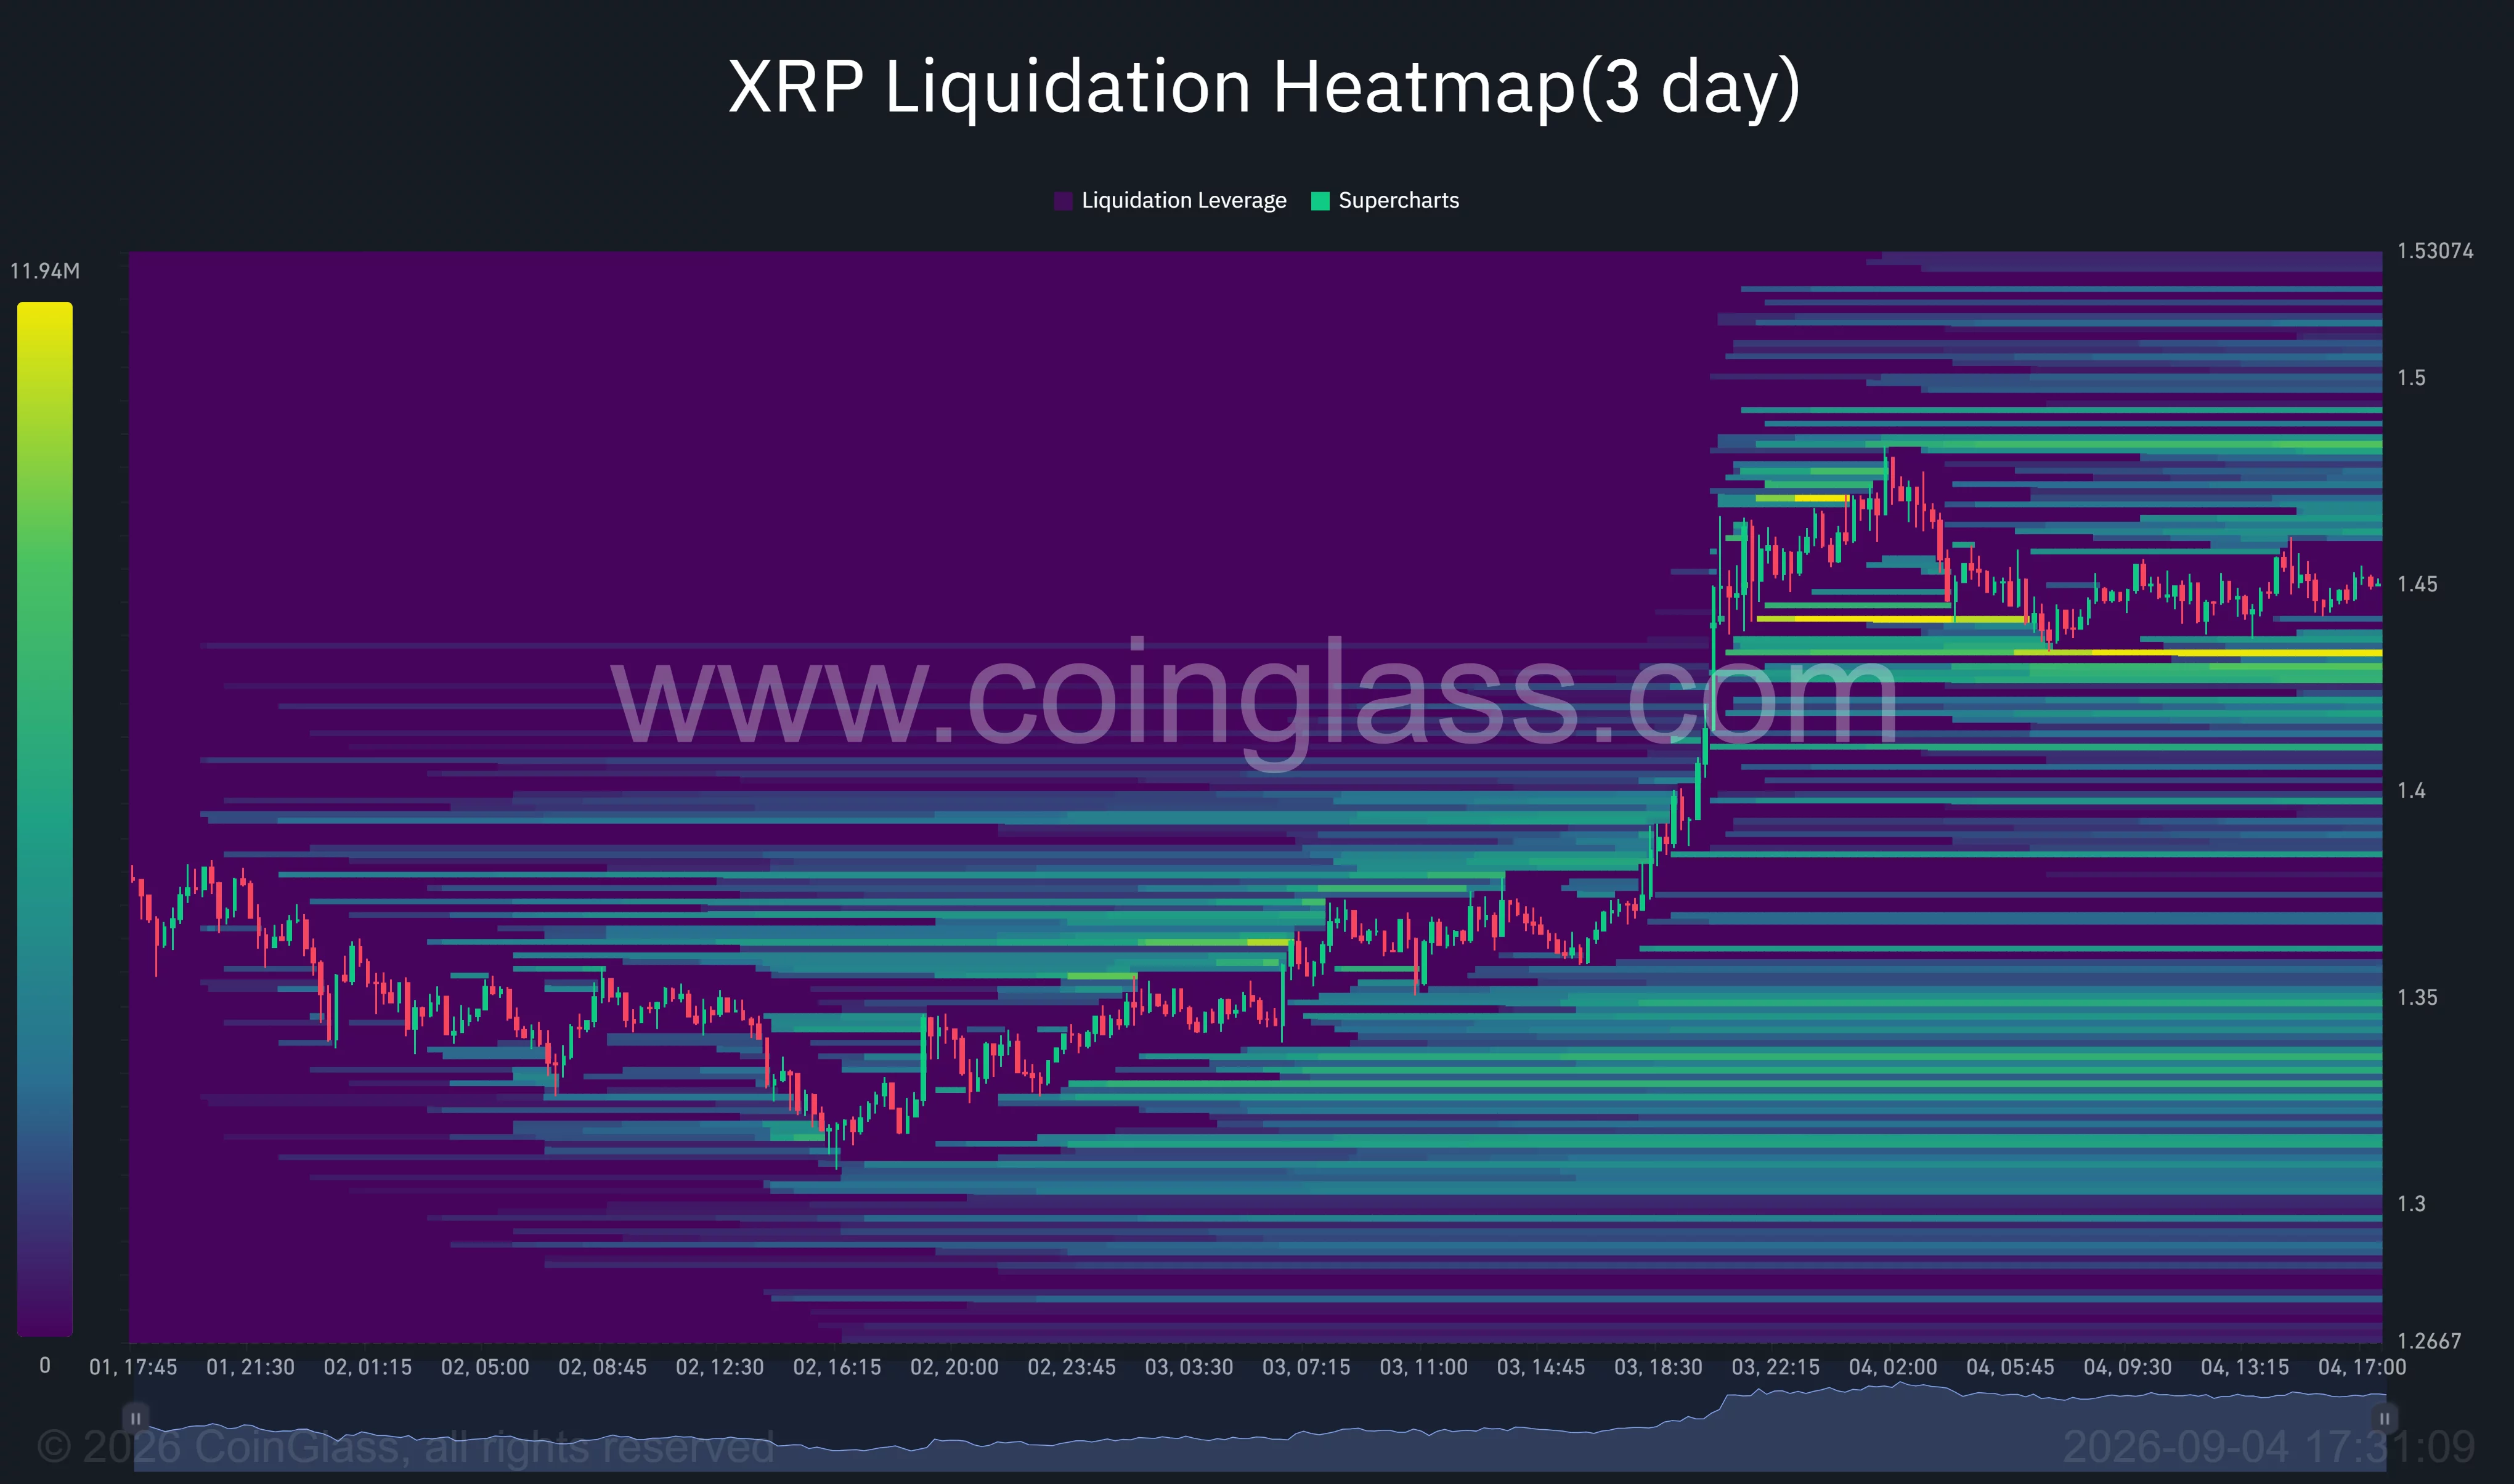
Additional liquidity is located at $1.40 and $1.37. The latter level is particularly significant as it coincides with the previous 4-hour channel resistance. A retest that holds above $1.37 would maintain the breakout structure.
Conversely, a drop below $1.37 would reopen the possibility of revisiting the lower end of the former channel near $1.30. Broader structural support is indicated by the daily Supertrend at $1.2439, close to ChartNerd’s 20-week EMA near $1.28.
Above the current price, liquidation positions concentrate between $1.48 and $1.53. A breach into this zone could necessitate short sellers to exit, leading to an increase in market buy orders and potentially quickening the price movement.
The heatmap highlights areas where leveraged positions might be vulnerable if market volatility escalates, but it does not guarantee the price will touch either liquidity pool.
Analysts Predict Higher Targets If Breakout Sustains
In a separate analysis, trader CW indicated that XRP’s prior correction ended near the 0.5 Fibonacci retracement level. The asset has since moved past the 0.618 retracement as per the analyst’s findings.
CW has targeted the next price level at around $2.135, representing the 1.618 Fibonacci extension. Achieving this would require XRP to navigate through several closer hurdles such as $1.50, $1.53, the August peak around $1.70, and ChartNerd’s $1.80 prediction.
The immediate resistance levels are crucial for the current market setup. A sustained advance above $1.53 would signal completion of the next phase in the breakout, while a rejection could confine XRP within a range of approximately $1.37 to $1.50.
Potential US Catalysts Could Heighten XRP Volatility
US-listed spot XRP exchange-traded funds witnessed net inflows totaling $110.49 million during the week ending August 28, marking their strongest weekly performance of 2026. This follows a period of elevated XRP ETF activity, with total inflows reaching around $1.6 billion.
Market participants are also monitoring the Senate’s procedural vote on the CLARITY Act set for September 15. This vote requires a supermajority of 60 votes to proceed and will conclude debate on the motion rather than pass the legislation itself. This bill could impact how U.S. regulatory authorities oversee digital assets.
Additionally, Federal Reserve policy poses another short-term risk. Fed Governor Christopher Waller mentioned on September 3 that three-month core inflation dropped from 4.76% in February to 3.05% by July.
Waller expressed support for maintaining current rates if forthcoming inflation data continues to show a downward trend, although he did not dismiss the possibility of raising rates if inflationary pressures reemerge. Therefore, the August inflation report and the Fed’s meeting on September 15–16 could affect liquidity in XRP and the broader cryptocurrency market.
At this stage, XRP’s 4-hour breakout leans towards bullish sentiment above $1.37. A closing price over $1.53 would bolster the case for targets of $1.70 and $1.80, while a breach below $1.37 could expose the $1.30–$1.24 support area.
Disclosure: This article does not constitute investment advice. The content and resources presented on this page are meant for educational purposes only.