

Key Points:
Over the past month, XRP’s price has fluctuated between $2.05 and $2.40, demonstrating consolidation within a bullish pennant pattern on the weekly chart.
Several market observers are noting that the present technical formation mirrors the price behavior seen in 2017, which preceded a significant surge to record highs.
XRP Price Aims for a 530% Climb, Potentially Reaching Double Digits
Since February 1st, the price of XRP (XRP) has been consolidating below the $3.00 mark. However, analysts suggest that a substantial recovery could occur from current levels if a breakout similar to that of 2017 transpires.
Crypto analyst Mikybull Crypto remarked that XRP’s price action on the three-week timeframe appears to be echoing a scenario from 2017. In that year, a breakout from a bull pennant resulted in an impressive climb of over 1,300%, ultimately reaching all-time highs near $3.40.
“I’ve witnessed this pattern before,” the analyst stated in a post on X from June 17th, adding:
“Reminds me of the 2017 rally vibes.”
The cryptocurrency’s price movement demonstrates a comparable setup on the weekly chart, as illustrated below.
A bull pennant is a bullish continuation pattern that emerges when the price experiences a rapid upward movement (the flagpole), followed by a pause and consolidation within a small symmetrical triangle (the pennant).
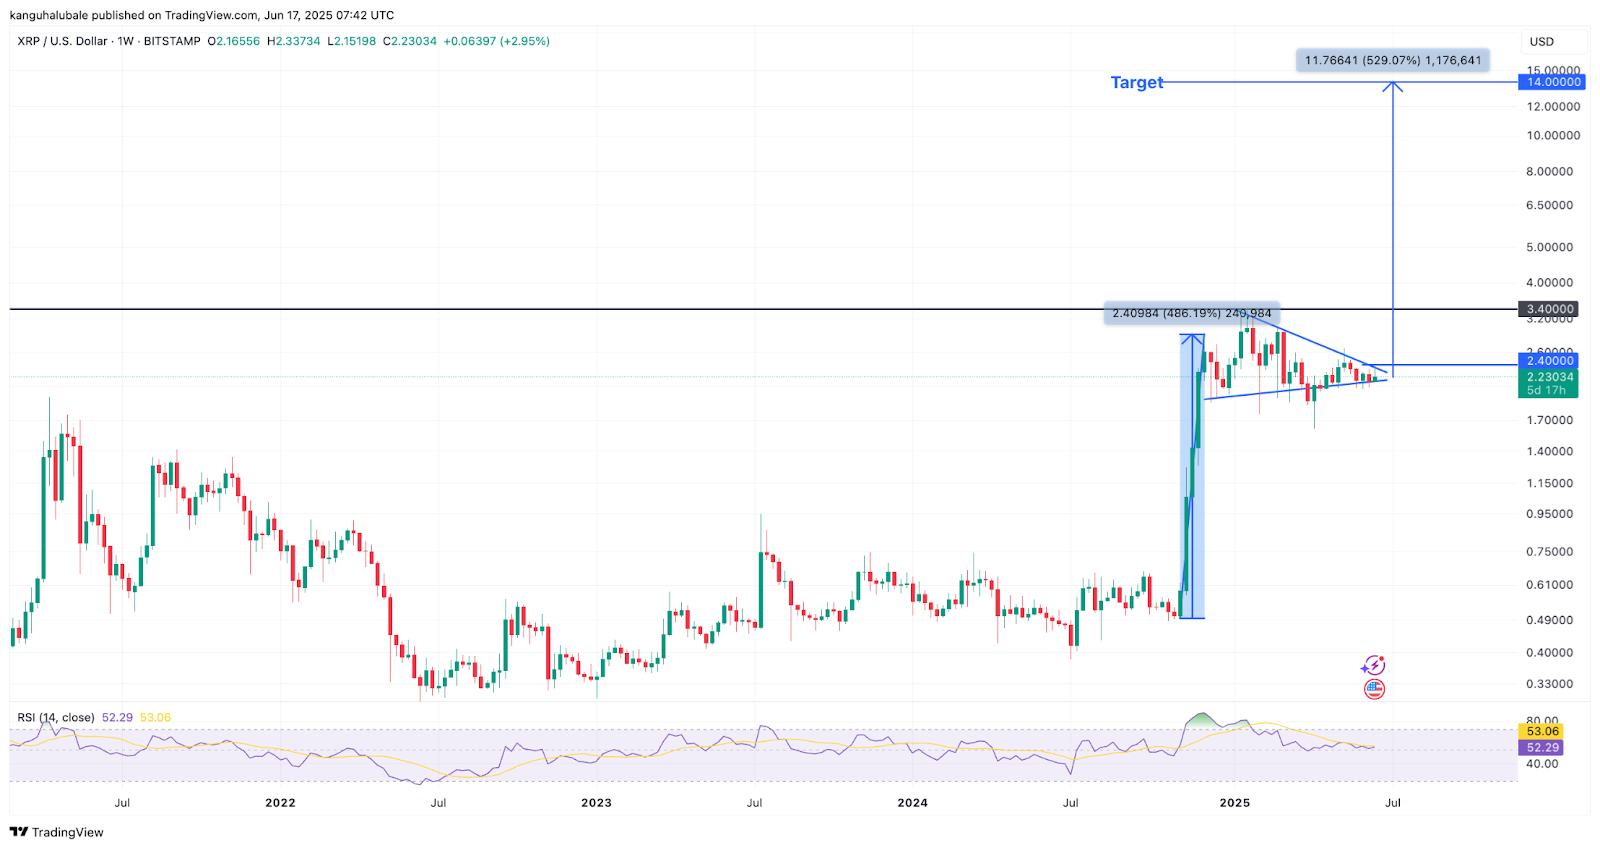
Bull pennants typically resolve when the price breaches the triangle’s resistance line and ascends by a magnitude equal to the height of the preceding uptrend. This positions the potential upper target for XRP’s price at $14, representing a 530% increase from its current valuation.
Related: Trident Digital Plans to Establish XRP Treasury Potentially Worth $500M
These analyses are in line with earlier forecasts of XRP reaching $27 based on similar historical patterns, Elliott Wave theory application, and Fibonacci extension levels. Other opinions suggest that XRP’s price could potentially rise by 1,100% to reach $25 if a spot XRP ETF receives regulatory approval in the United States.
XRP Needs to Retake the 200-day SMA to Fuel Further Gains
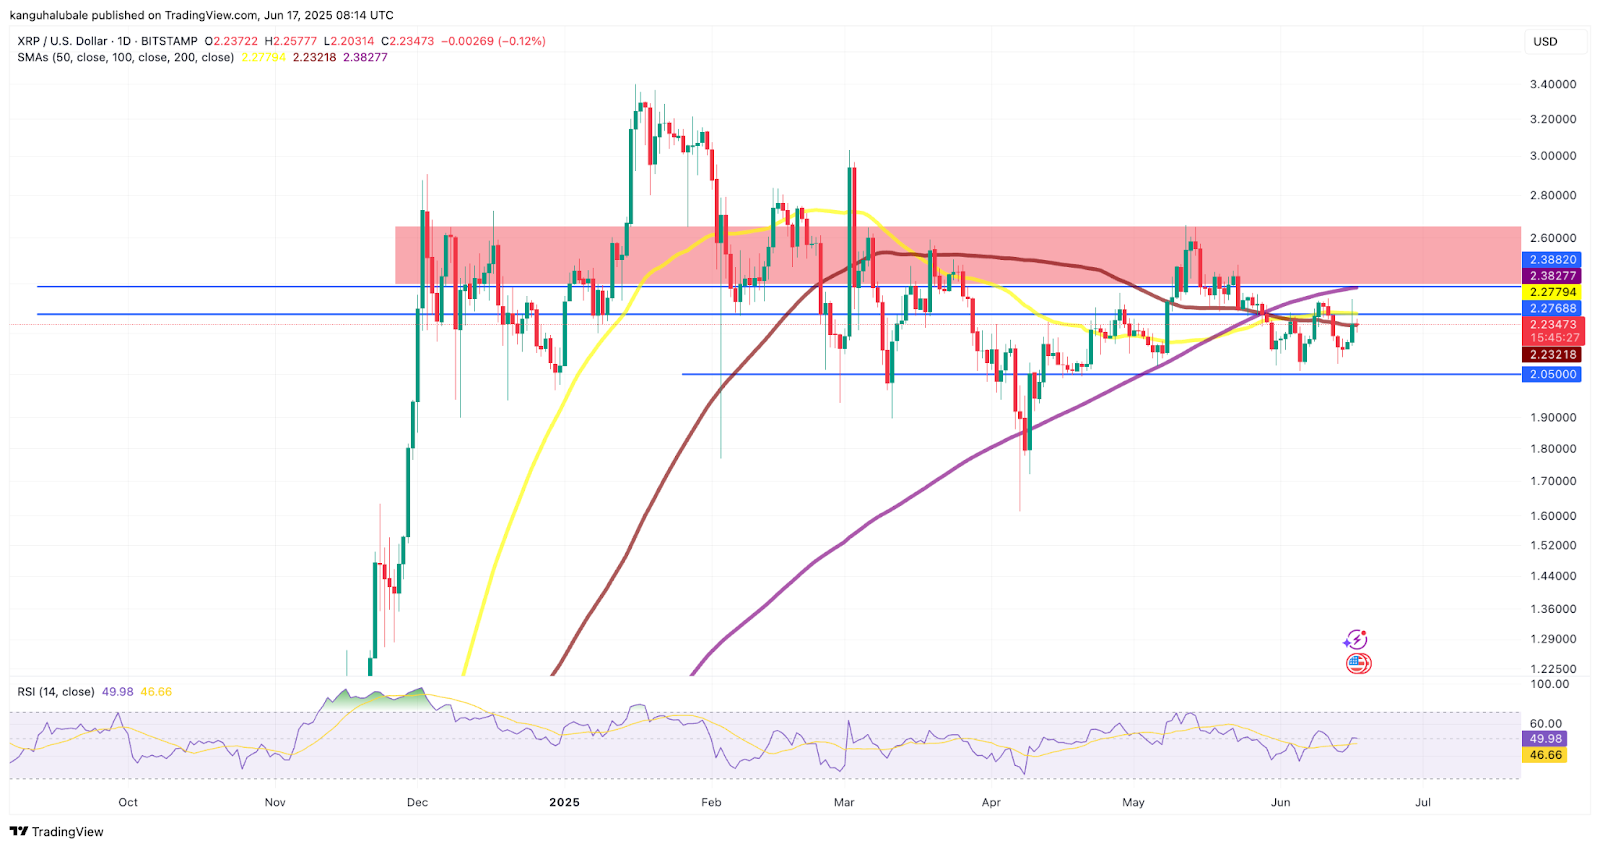
XRP’s potential for upward momentum is part of a recovery phase that started around April 10th, which saw the relative strength index (RSI) increase to 52 at the time of this writing, moving from oversold conditions at 29.
XRP bulls are aiming to surpass the resistance positioned at $2.27, which represents the 50-day simple moving average (SMA).
A positive outlook for the altcoin is dependent on transforming the resistance zone between $2.37 (the 200-day SMA) and $2.65 into a new level of support.
Sustained trading above this zone will signal another successful breach beyond the 50-day SMA, thereby setting the stage for a return to the $3.00 level, or even reaching the seven-year high above $3.31.
As Cointelegraph previously reported, overcoming the $2.65 resistance could initiate a lasting recovery, potentially driving XRP’s price above the $3.00 mark.
This information is for informational purposes only and should not be interpreted as financial advice. All investments carry risk, and individual research is crucial before making any investment decisions.