

XRP
(XRP) reached a notable milestone, closing its weekly trading period at $2.60, a peak unseen in several years. This also marks the first time XRP has achieved a higher peak since January 2018, roughly seven years in the past.
XRP 1-week chart. Source: Cointelegraph/TradingView
With the cryptocurrency breaking through a significant resistance level at $2 on its monthly chart, one market observer expressed an optimistic view regarding XRP’s market structure.
XRP’s Chart: A Standout in the Crypto Space
In a statement made on
X, Peter Brandt, a seasoned and well-regarded trader, declared that XRP’s chart is currently “the most powerful chart in all of crypto world.” Examining XRP’s weekly market capitalization chart, Brandt emphasized the altcoin’s decisive move above a symmetrical triangle pattern that had persisted for several months, placing its value near its record high of $3.40.
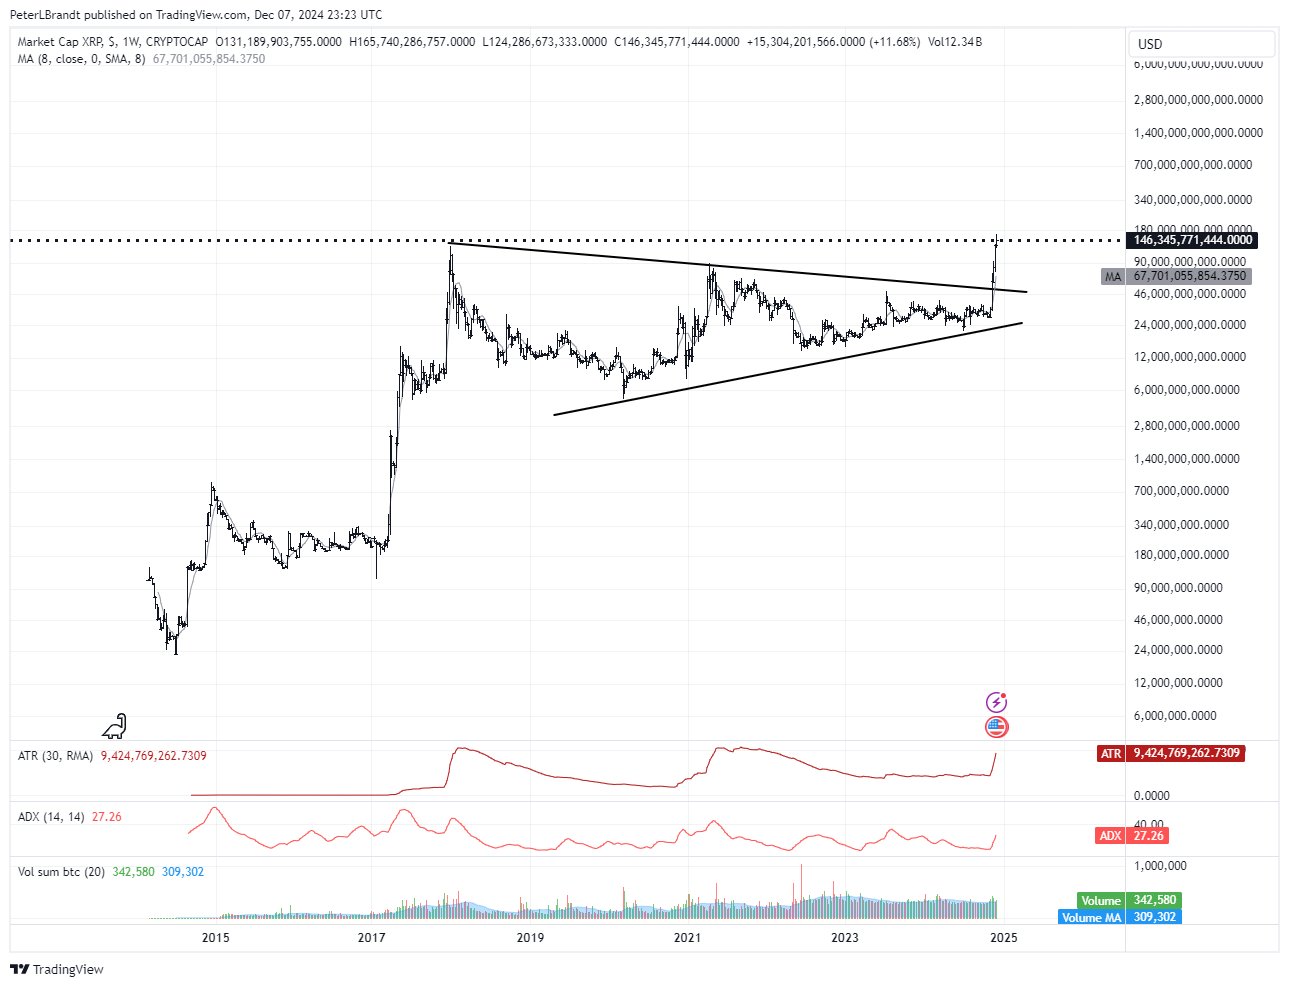
XRP 1-week chart analysis by Peter Brandt. Source: X.com
Brandt’s statement suggests an expectation of continued upward movement for the altcoin, as the market’s architecture strongly indicates bullish strength and momentum for XRP.
In the short term, independent analyst Dom
noted that the $2.67 level is “the most important level to flip” to confirm the continuation of the upward trend.
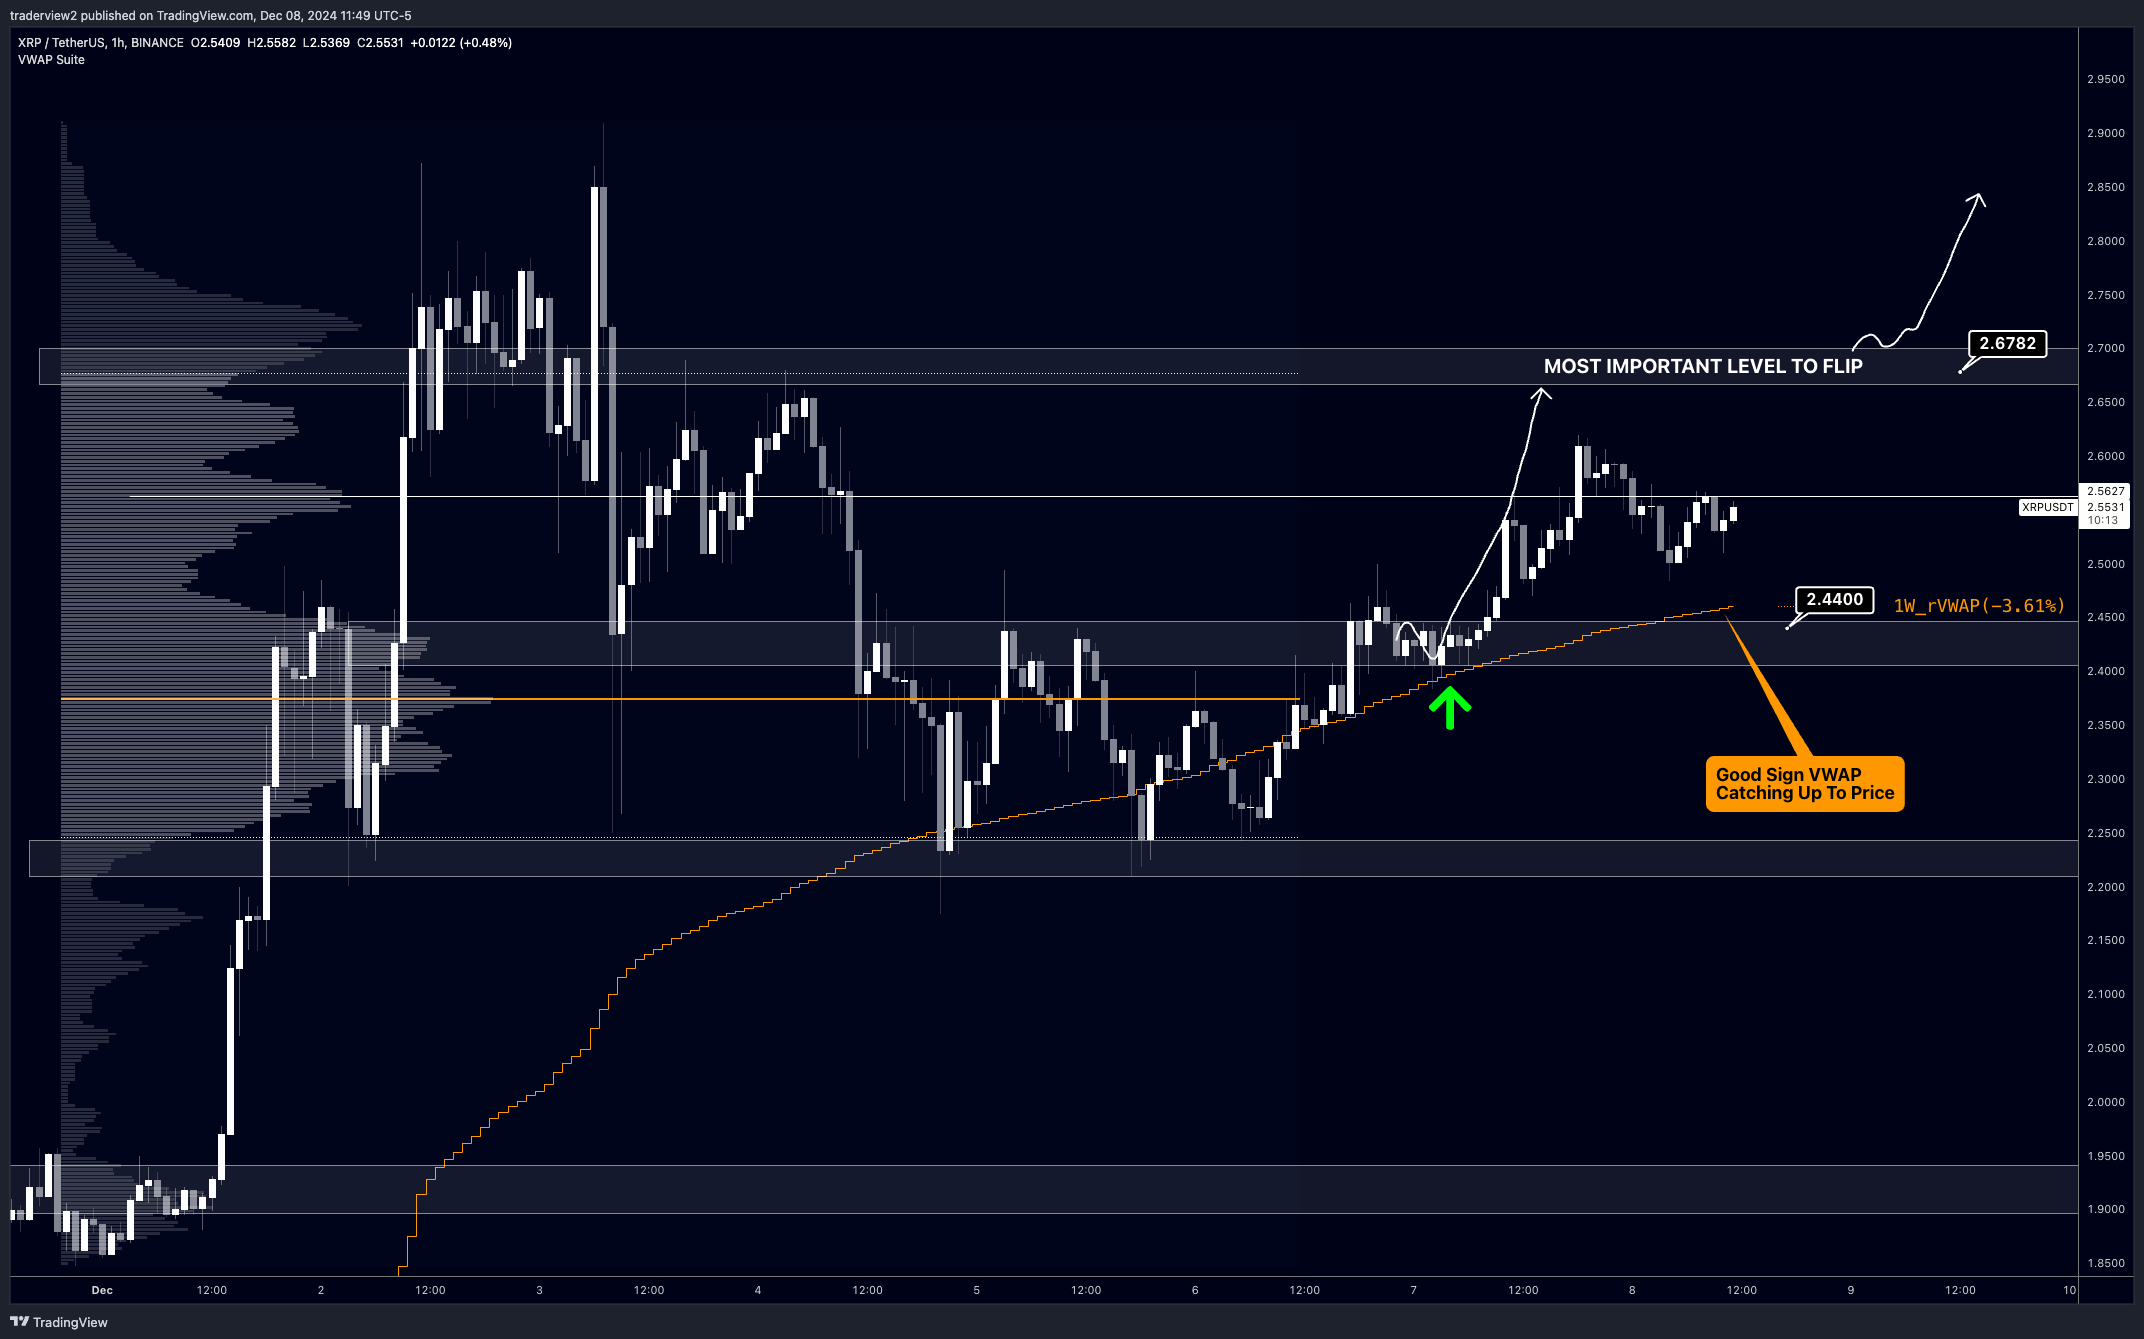
XRP 1-hour analysis by Dom. Source: X.com
Analyzing the 1-hour chart, the trader observed that reaching $2.60 the previous week was a positive development, but converting that resistance into a support level is crucial for XRP. The trader commented:
“While it’s a good bounce, we must note ~$2.67 zone is the most important level to flip, anything under is noise.”
However, despite the positive shift in November, Rajat Soni, a personal finance expert, offers a markedly different perspective on XRP. In a post on X, the CFA characterized XRP’s recent price surge as “not natural,” suggesting it resembled a “pump and dump” scheme. Soni
stated:
“If you can’t see that this is a scam, you deserve to be scammed.”
Related: Could XRP Hit $5? Charts Suggest Current Rally May Continue
Bullish Pennant Pattern Suggests Further XRP Gains
Examining the technical charts, XRP’s 4-hour chart displays a bullish pennant formation. Previously, after a breakout, this pattern accurately predicted the cryptocurrency’s Fibonacci extension levels.
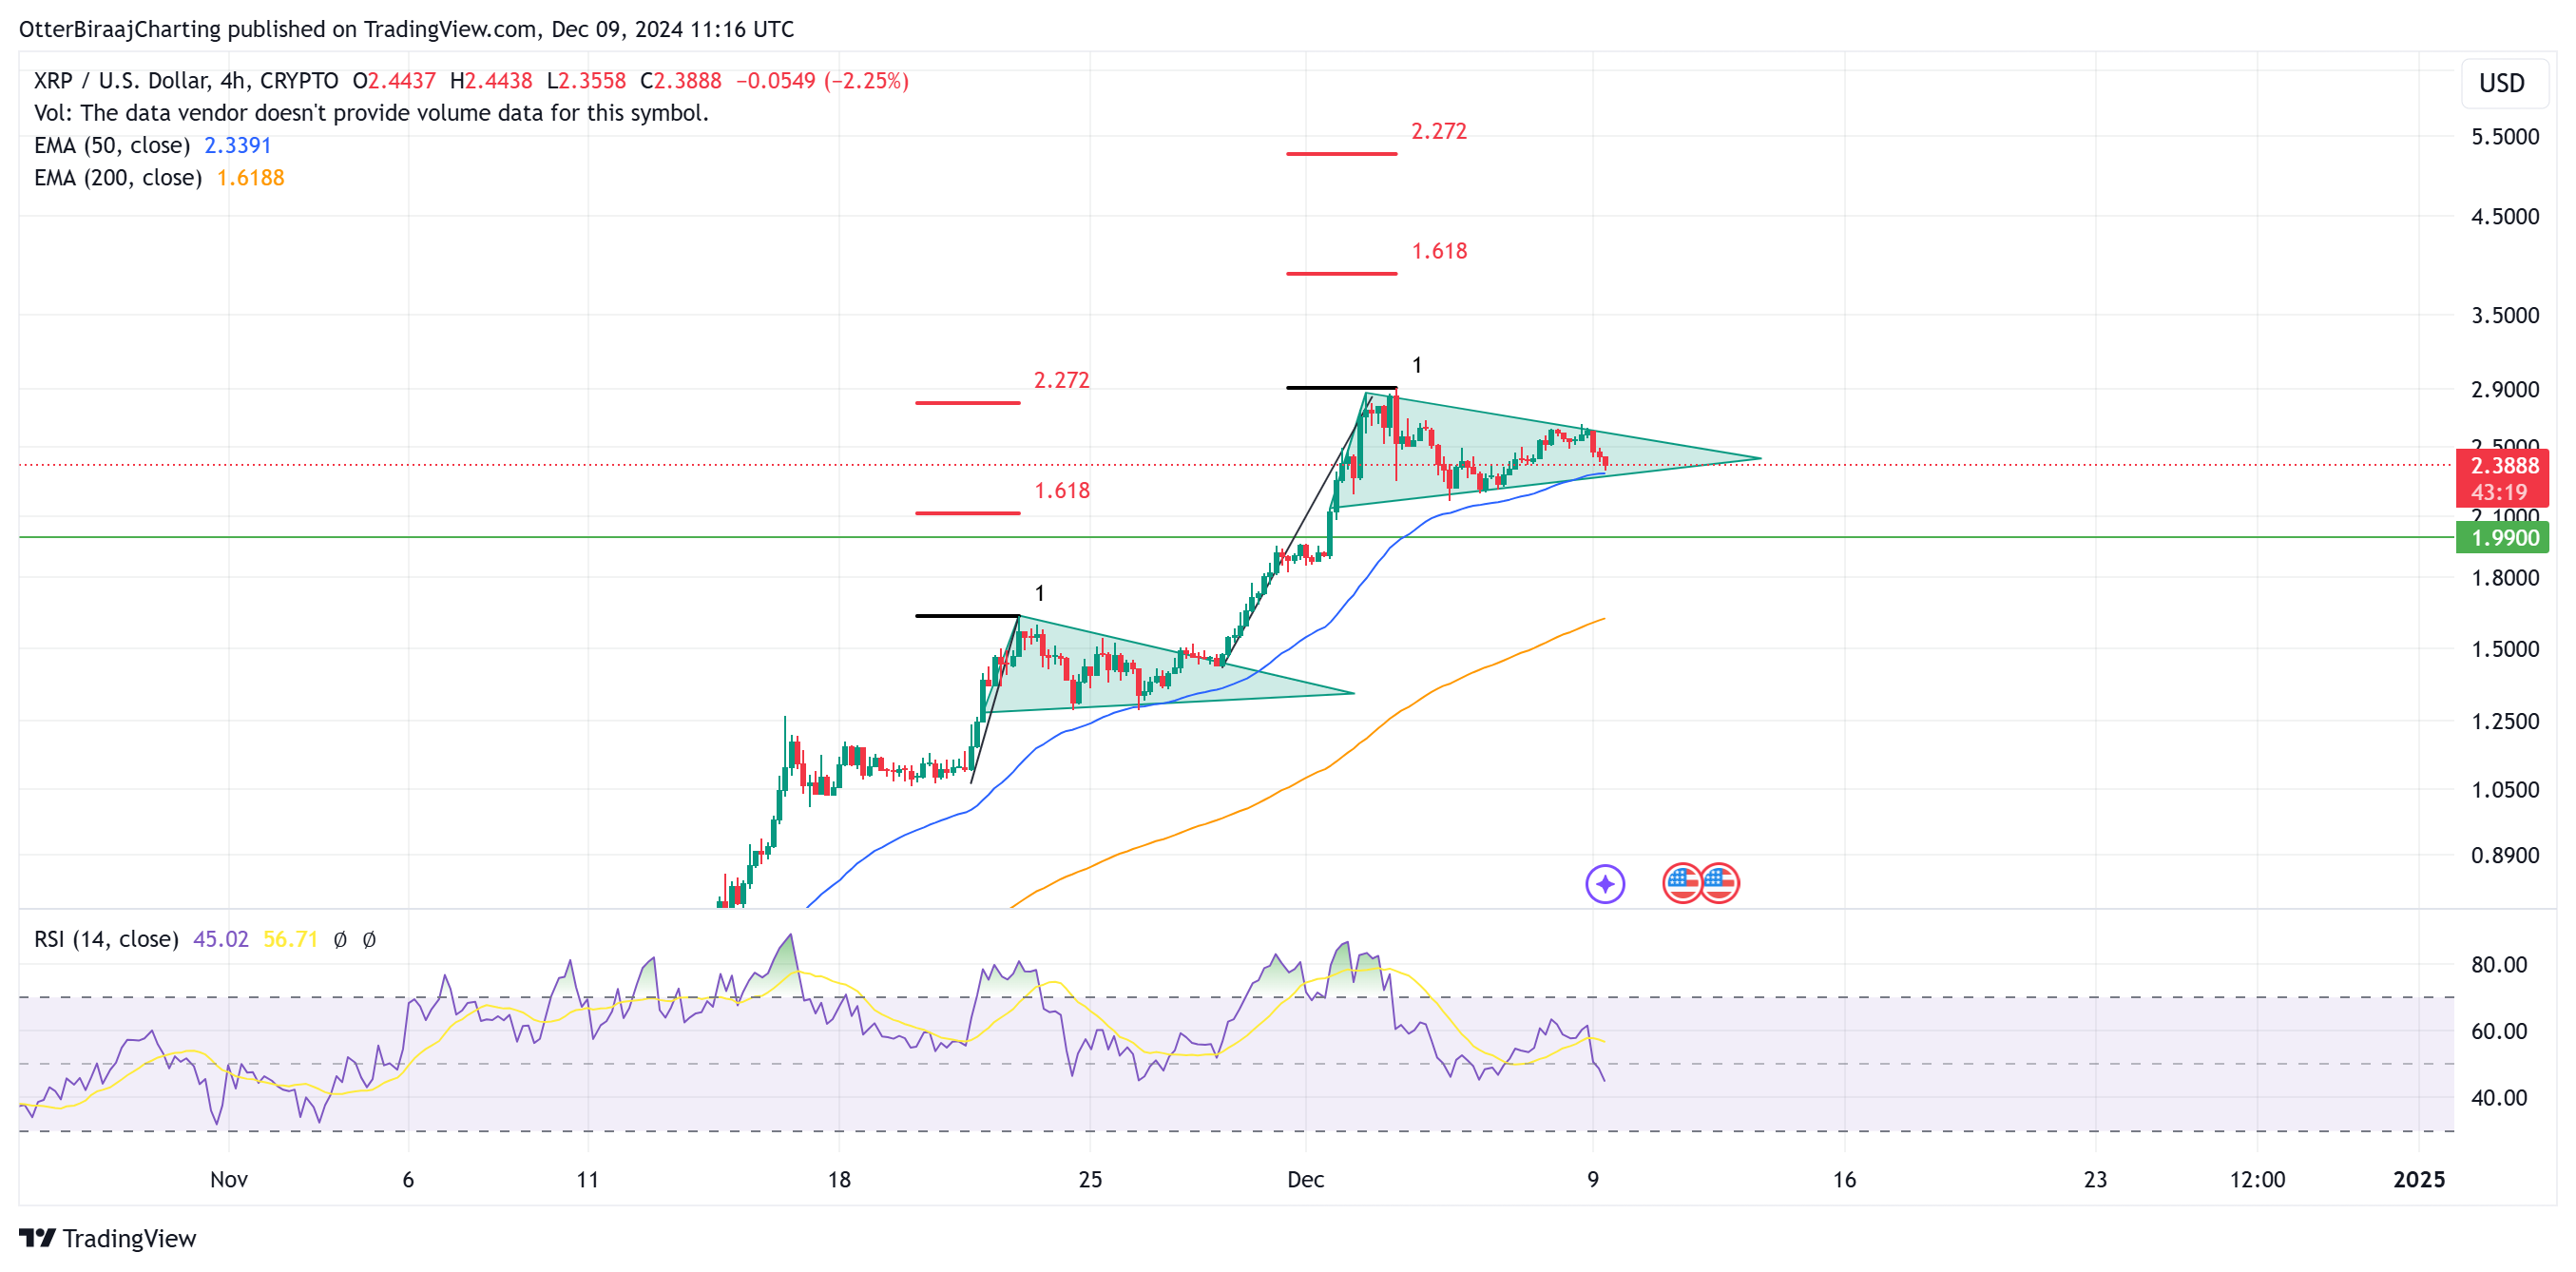
XRP 4-hour chart. Source: Cointelegraph/TradingView
As illustrated, XRP’s 4-hour chart reveals a bullish pennant pattern similar to one observed last month, which propelled XRP’s value above the crucial $2 resistance. The present setup shows similar bullish indicators, as the price retraces to test the 50-day EMA alongside a retest of the relative strength index (RSI) around the 50 level.
Considering both the bullish pattern and confirming indicators, XRP reached its anticipated FIB extension levels at 1.618 and 2.272. Should a similar breakout occur in the coming weeks, XRP could surpass its all-time high of $3.80, with current extension levels setting the immediate target.
Related: What’s Causing XRP’s Recent Price Decline?
This article should not be interpreted as financial advice. Trading and investing carry inherent risks. Investors should conduct their own thorough research before making any decisions.