

Key Levels to Watch for $XRP
Weekly data from the Bollinger Bands highlights the significance of the current price range. The bands have expanded on the weekly chart, indicating that $XRP has been experiencing increased price volatility lately.
The upper band is now positioned at $1.5815, slightly above the current trading price. This marks the initial key resistance $XRP must surpass to continue its recovery. The lower band is set at $1.24, which has previously provided support.
The range between $1.24 and $1.25 became crucial following the selloff that occurred after the August highs. Specifically, $XRP dropped to this level before buyers stepped in, driving the price higher during the late-September bounce. Given this previous response, this zone is a key area to monitor if $XRP experiences additional downward pressure.
At present, the more immediate key level is $1.4466, which corresponds to the daily lower Bollinger Band. Should $XRP drop below $1.4466, focus could return to the $1.24 to $1.25 range. Conversely, maintaining levels above $1.4466 would allow for potential progress towards the $1.5815 resistance.
Weakening Directional Momentum for $XRP
The weekly Directional Moving Index (DMI) indicates that the momentum behind $XRP’s upward movement is also diminishing.
The +DI is currently at 28.57 and declining, while the ADX sits at 28.46, also on a downward trajectory. Meanwhile, the -DI, which signifies downward pressure, hovers around 17.15 and is also decreasing.
The falling ADX suggests that the prevailing trend is losing momentum. Moreover, a drop in the +DI indicates that buying pressure has lessened compared to prior levels. While buyers maintain a technical edge since the +DI is above the -DI, this advantage is narrowing as $XRP undergoes this correction.
Momentum and Money Flow Signals Caution
In the meantime, the daily MACD is reflecting a shift in short-term momentum. The histogram recorded nine straight sessions of positive bars but recently turned negative as September ended.
As it stands, the MACD line is at 0.0424, compared to a signal line of -0.0047. While the MACD line remains slightly positive, the shift in the histogram suggests a rise in bearish momentum.
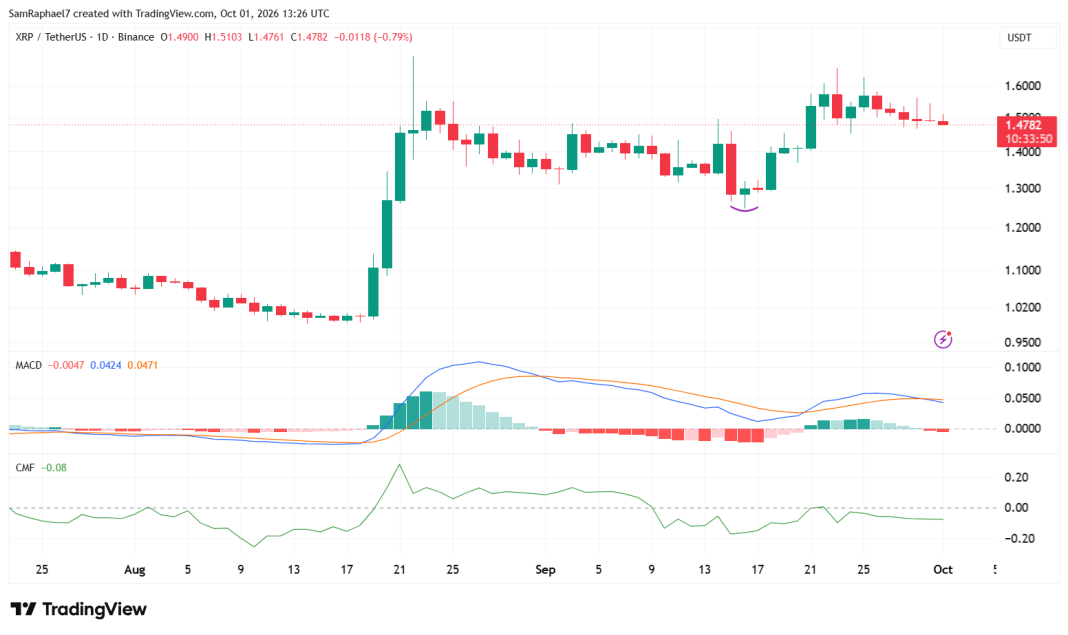
Additionally, the Chaikin Money Flow (CMF) on Binance’s daily chart peaked at 0.01 on September 22, indicating a temporary improvement in buying pressure, but has since dropped to -0.08. This negative reading suggests an increase in sell-offs of $XRP, contributing to the selling pressure around the token.
What $XRP Requires
$XRP must maintain significant support levels while also attempting to regain resistance above. A movement beyond $1.5815 would strengthen buyer positions and shift focus back to $1.6569. This level represents a prior barrier that hindered the previous recovery.
If $XRP falls below $1.4466, the risk escalates. Such a decline would redirect attention to the $1.24 to $1.25 range, a level that has previously halted the token’s downturn twice in this broader cycle. Observing how $XRP responds at $1.4466 and $1.5815 will indicate whether the current pullback can stabilize or if sellers will drive the price further down.