
Bitcoin didn’t just dip. It got cut in half.
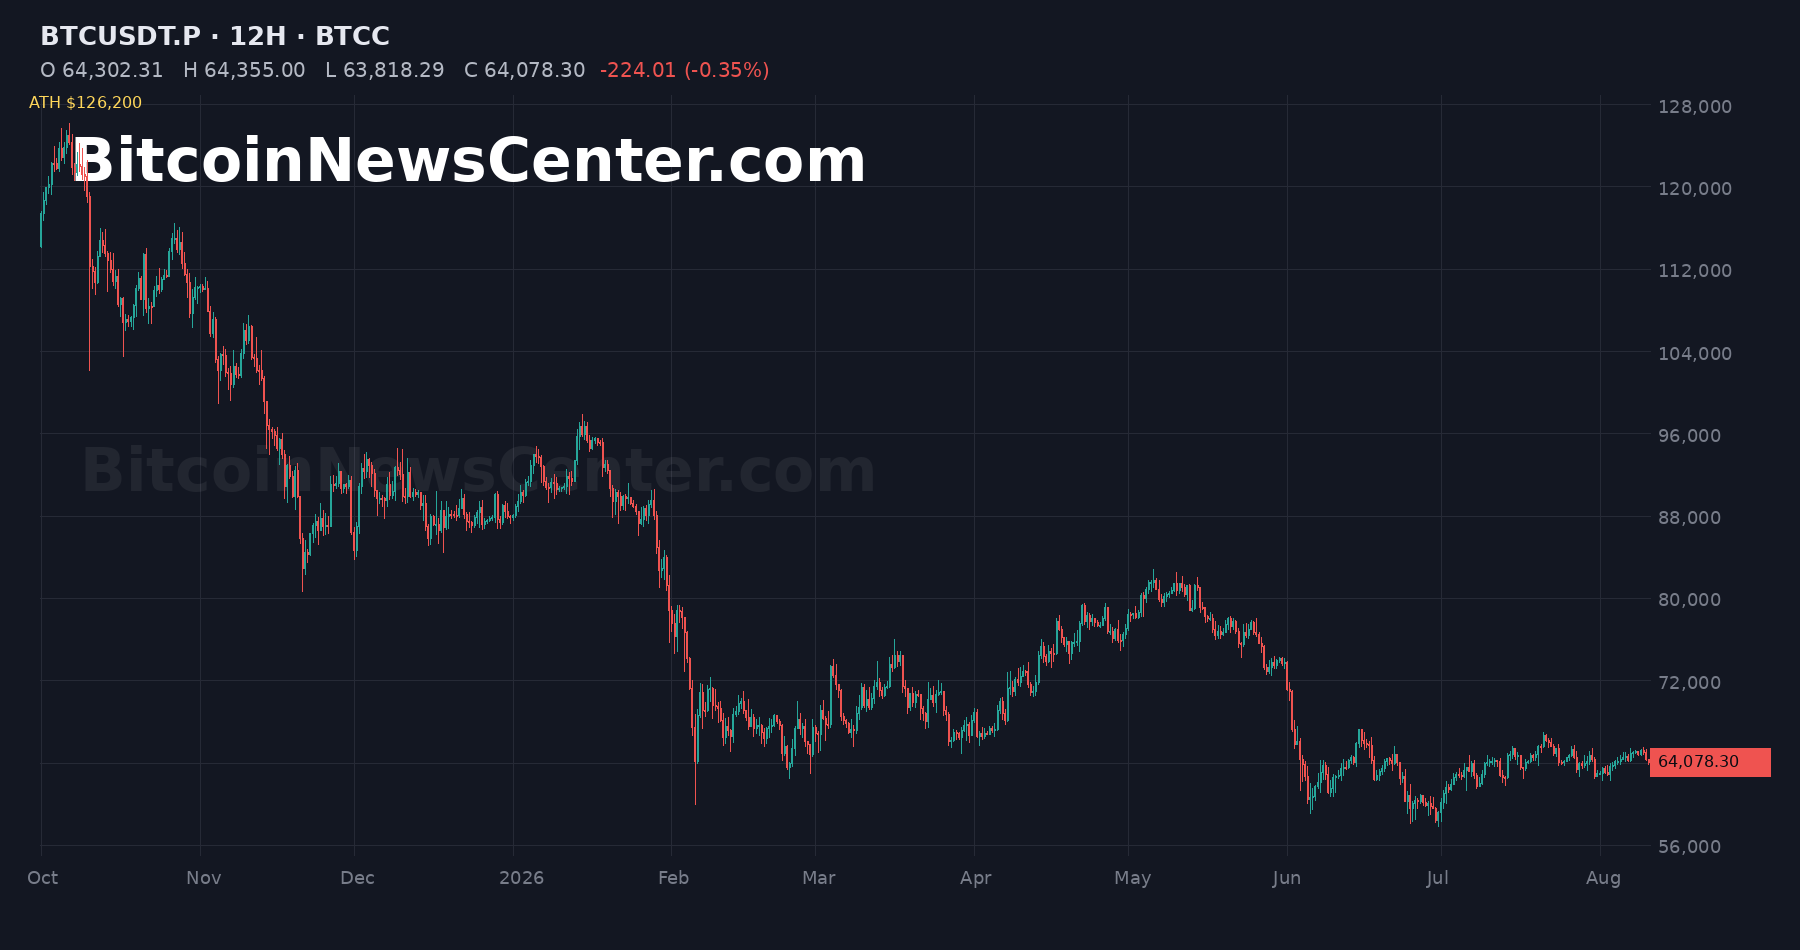
Ten months ago, Bitcoin was the toast of Wall Street, printing a fresh all-time high of $126,200 and dragging the entire crypto market into a state of near-euphoria. Today, the world’s largest cryptocurrency is trading at roughly $64,078 — a jaw-dropping 49.2% collapse that has vaporized more than $62,000 of value per coin and left even seasoned traders shell-shocked.
The 12-hour BTCUSDT chart tells the entire savage story in a single frame — a staircase of lower highs, brutal breakdowns, and one cruel head-fake after another. Here’s how Bitcoin went from champagne to carnage.
The Peak That Felt Invincible
Back in early October 2025, nothing could stop it. Bitcoin ripped to $126,200 on October 6, and the mood was electric. Analysts were dusting off six-figure price targets, retail was piling in, and “up only” felt less like a meme and more like a law of physics.
It was, in hindsight, the top. And the market had no idea.
The Slow-Motion Avalanche
The unraveling started quietly — a lower high here, a failed bounce there. By December, Bitcoin had shed nearly a third of its value, sliding toward the $80,000 region as buyers who’d chased the highs began heading for the exits. Every rally was sold. Every “bottom” was a trapdoor.
A brief flicker of hope arrived in late January, when BTC clawed back toward $96,000 and the bulls dared to dream again. Then February happened.
February’s Cliff
The chart’s most violent move is impossible to miss: a near-vertical plunge that erased weeks of recovery in a matter of days, slamming Bitcoin from the mid-$90,000s down into the $68,000s. It was the kind of candle that liquidates leverage, ends careers, and turns confident bulls into silent spectators.
A Cruel Head-Fake
Markets love to give hope right before they take it away. Through April and into May, Bitcoin mounted its most convincing comeback of the entire downtrend, grinding all the way back to $82,850. Traders called the bottom. Headlines whispered “recovery.”
They were wrong again. The rally rolled over, and by June the selling resumed with a vengeance.
Capitulation
On June 30, 2026, Bitcoin printed its lowest point of the entire cycle: $57,803. That’s a stomach-churning 54% below the October peak — the moment of maximum pain, when it felt like the bleeding might never stop.
Where We Stand Now
Here’s the twist worth watching: since that June bottom, Bitcoin has quietly clawed back +10.9% to today’s $64,078. The most recent candles show a tight, grinding consolidation — neither the runaway crash of February nor the false hope of May, but a coiled, uneasy stalemate between exhausted sellers and cautious buyers.
In other words: Bitcoin is standing at a crossroads. Hold this zone, and the June low starts to look like a floor. Lose it, and $57,800 goes back on the table — with air beneath it.
The Bottom Line
Bitcoin has lost half its value in ten months, and the 12-hour chart leaves no room for spin — this has been one of the most punishing stretches in recent memory. But the same chart also shows a market that’s stopped falling and started fighting. Whether that fight becomes a floor or just the next cruel head-fake is the question every trader is now asking.
Volatility this savage is exactly where disciplined, data-driven strategy separates the survivors from the liquidated.
Want to know how the machines are trading this exact market — with live signals, real-time alerts, and battle-tested strategy instead of guesswork? Get the edge at American Crypto Traders — premium trading signals, live alerts, and real results.
This article is for informational purposes only and is not financial advice. Cryptocurrency trading involves substantial risk. Always do your own research.