

Bitcoin (BTC), Ethereum (ETH), and Ripple (XRP) are showing negative trends this Friday, marking a third consecutive day of losses as they approach critical support levels. The ongoing bearish sentiment dampens the likelihood of a rebound despite some positive signals from the RSI.
The technical analysis suggests a strongly bearish outlook for Bitcoin, Ethereum, and XRP. Continued losses on Friday could hinder any potential for a price recovery.
Will Bitcoin Recover Above $60,000?
Bitcoin is trading slightly under the $60,000 mark on Friday, maintaining a bearish outlook. Nevertheless, buying support at this critical level has so far prevented a decisive downtrend, while the price continues to linger below the 50-day Exponential Moving Average (EMA) at $67,849 and the 200-day EMA at $77,100.
Furthermore, the Moving Average Convergence Divergence (MACD) indicator is flattening around its signal line, indicating a gradual loss of momentum. The Relative Strength Index (RSI) is just above the oversold area near 30, suggesting ongoing selling pressure. However, this RSI reading is higher than during the previous drop to $60,000, indicating potential bullish divergence. This opens the door for a possible double-bottom reversal in Bitcoin if sellers do not gain clear control.
For Bitcoin, a key support level beneath $60,000 is positioned at the low of $53,485 established on July 5, 2024.
On the upside, the nearest resistance can be found at the 50-day EMA around $67,849, which aligns with the bearish trend.
Ethereum Fights to Hold Above $1,500
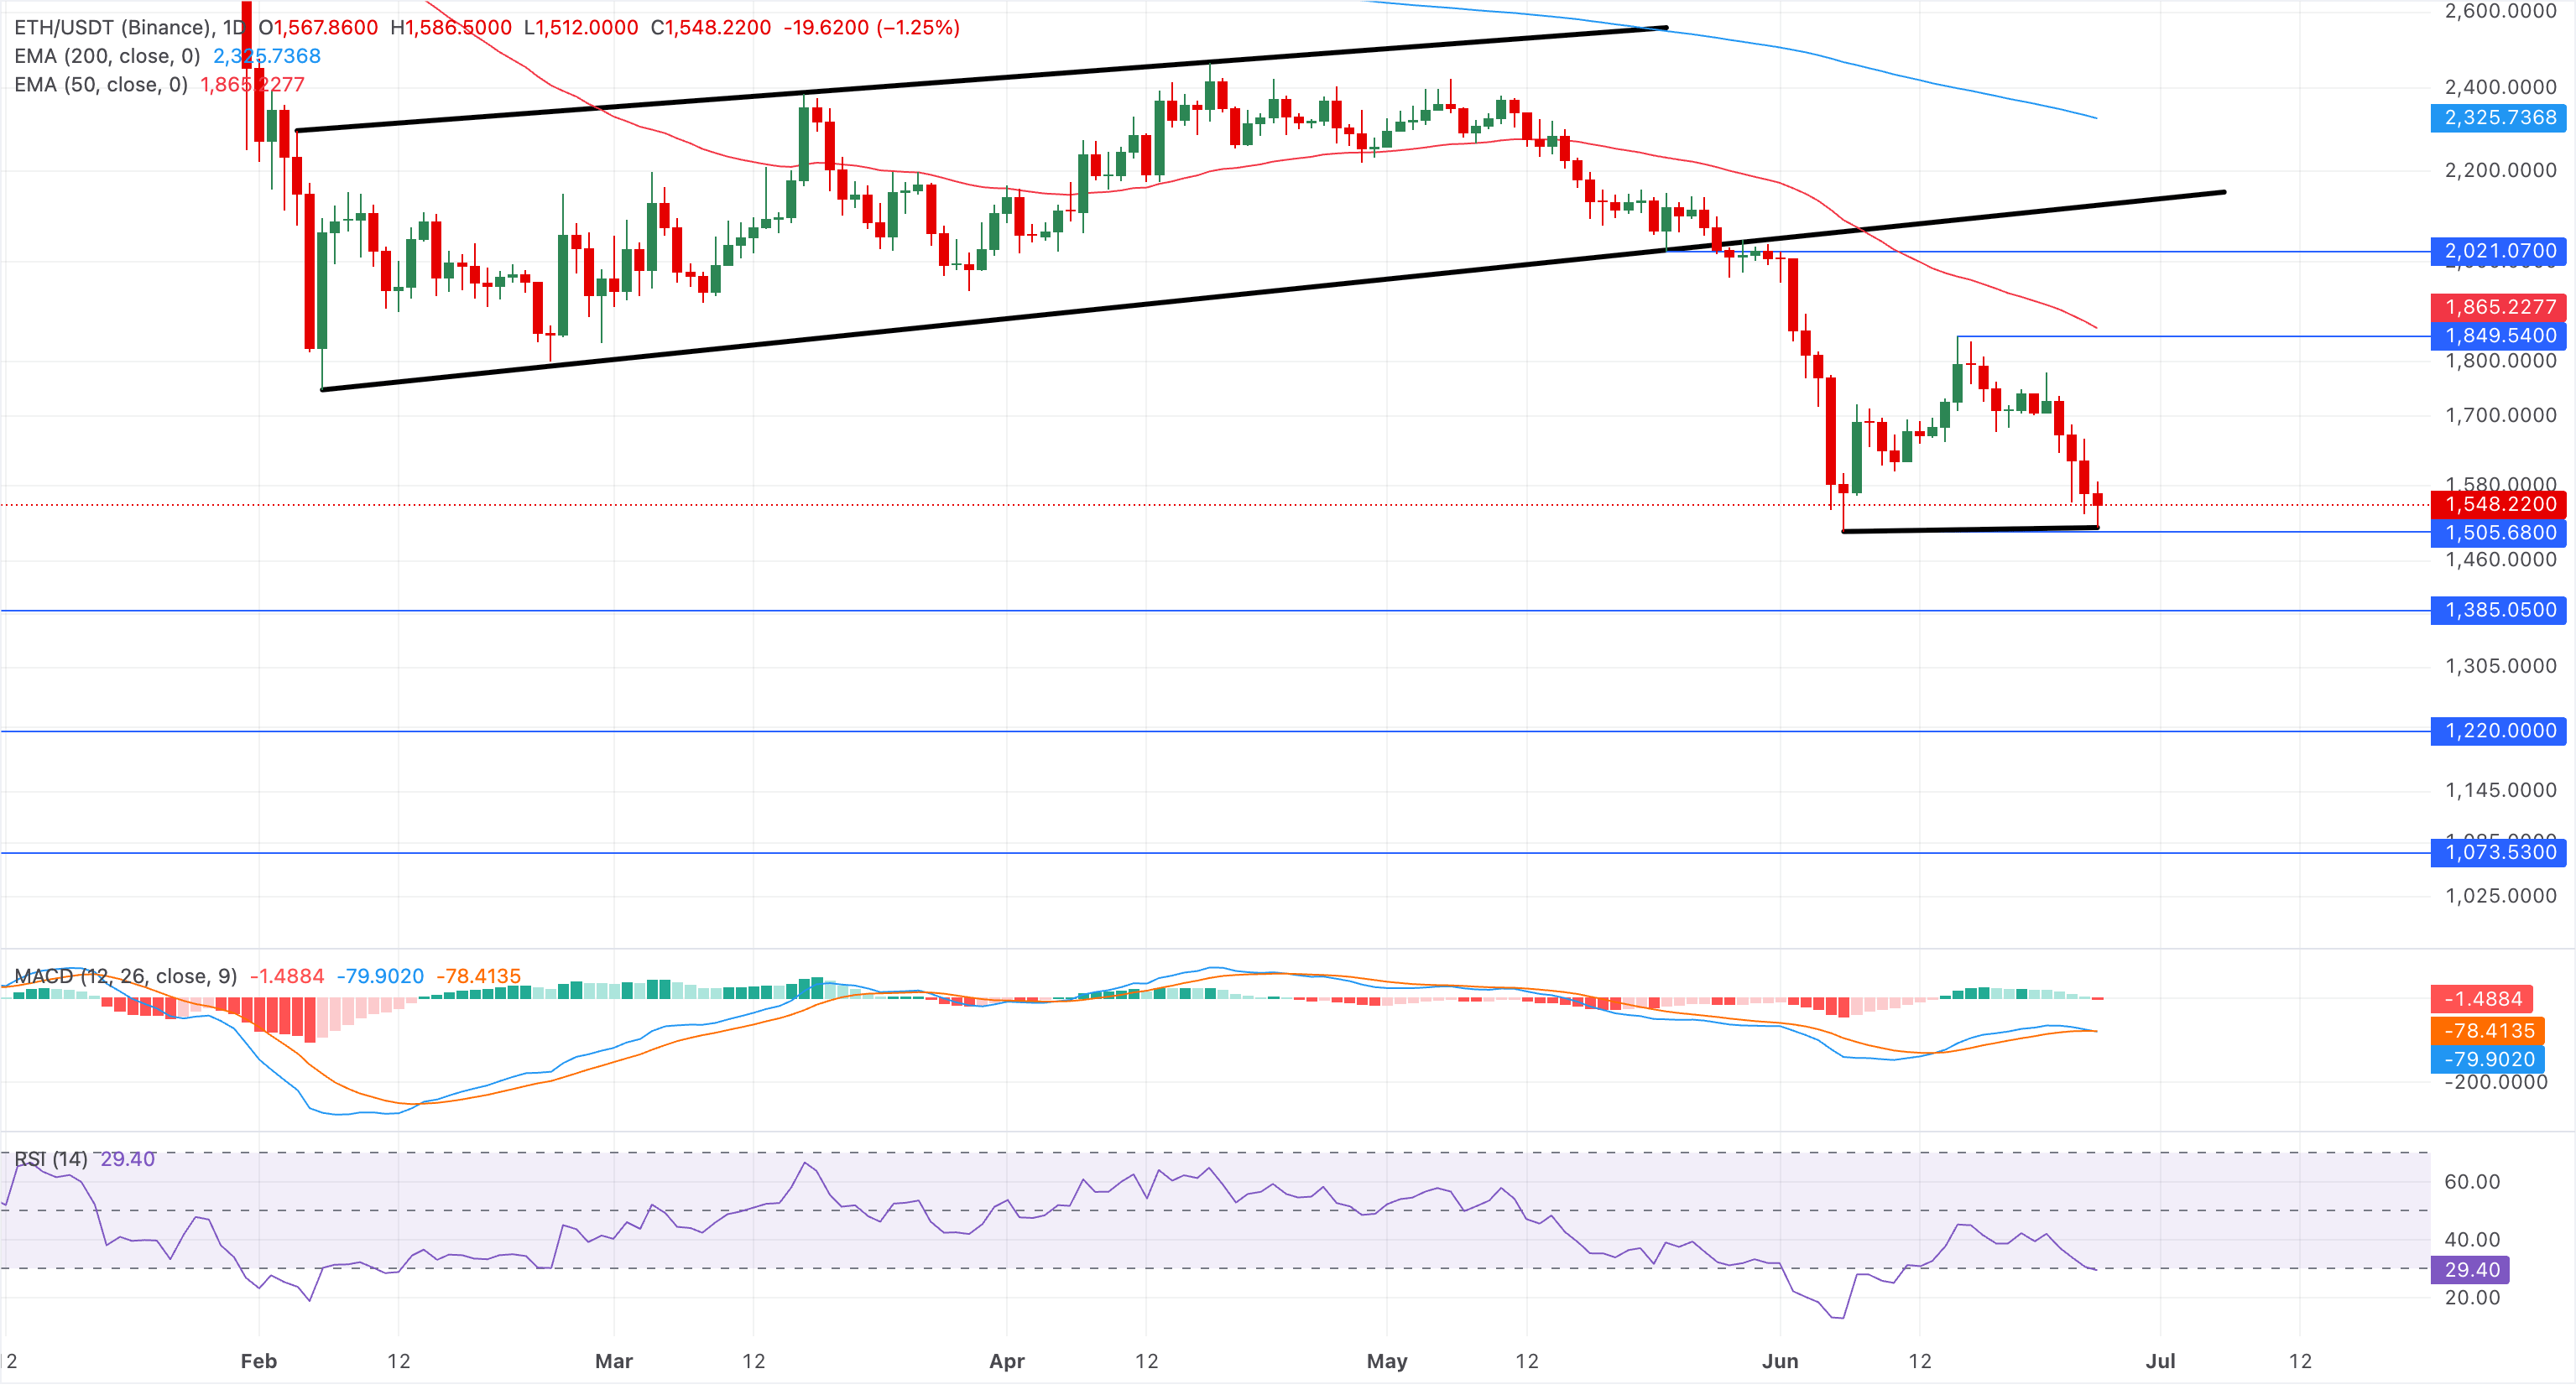
Ethereum is precariously positioned above $1,500 on Friday, experiencing its fourth straight day of losses. The leading altcoin is firmly in a bearish trend, with prices significantly below the 50-day EMA at $1,865 and the 200-day EMA at $2,325.
Technically, Ethereum’s ability to stay above its low of $1,505 from June 6 keeps the opportunity for a potential double-bottom formation alive, contingent on sustained buying pressure. A rebound in ETH would require surpassing the June 15 peak at $1,849 and the 50-day EMA at $1,865 to confirm a bullish breakout.
The RSI, currently at 29, indicates oversold conditions; however, this is a higher reading compared to the June 6 low of 12, hinting at a possible hidden bullish divergence. Yet, the MACD and its signal line are in danger of a bearish crossover, reaffirming the prevailing selling pressure.
A drop below $1,500 could lead to further declines toward the April 9, 2025, low of $1,385, reaching a new 14-month low.
Ripple at a Critical Junction
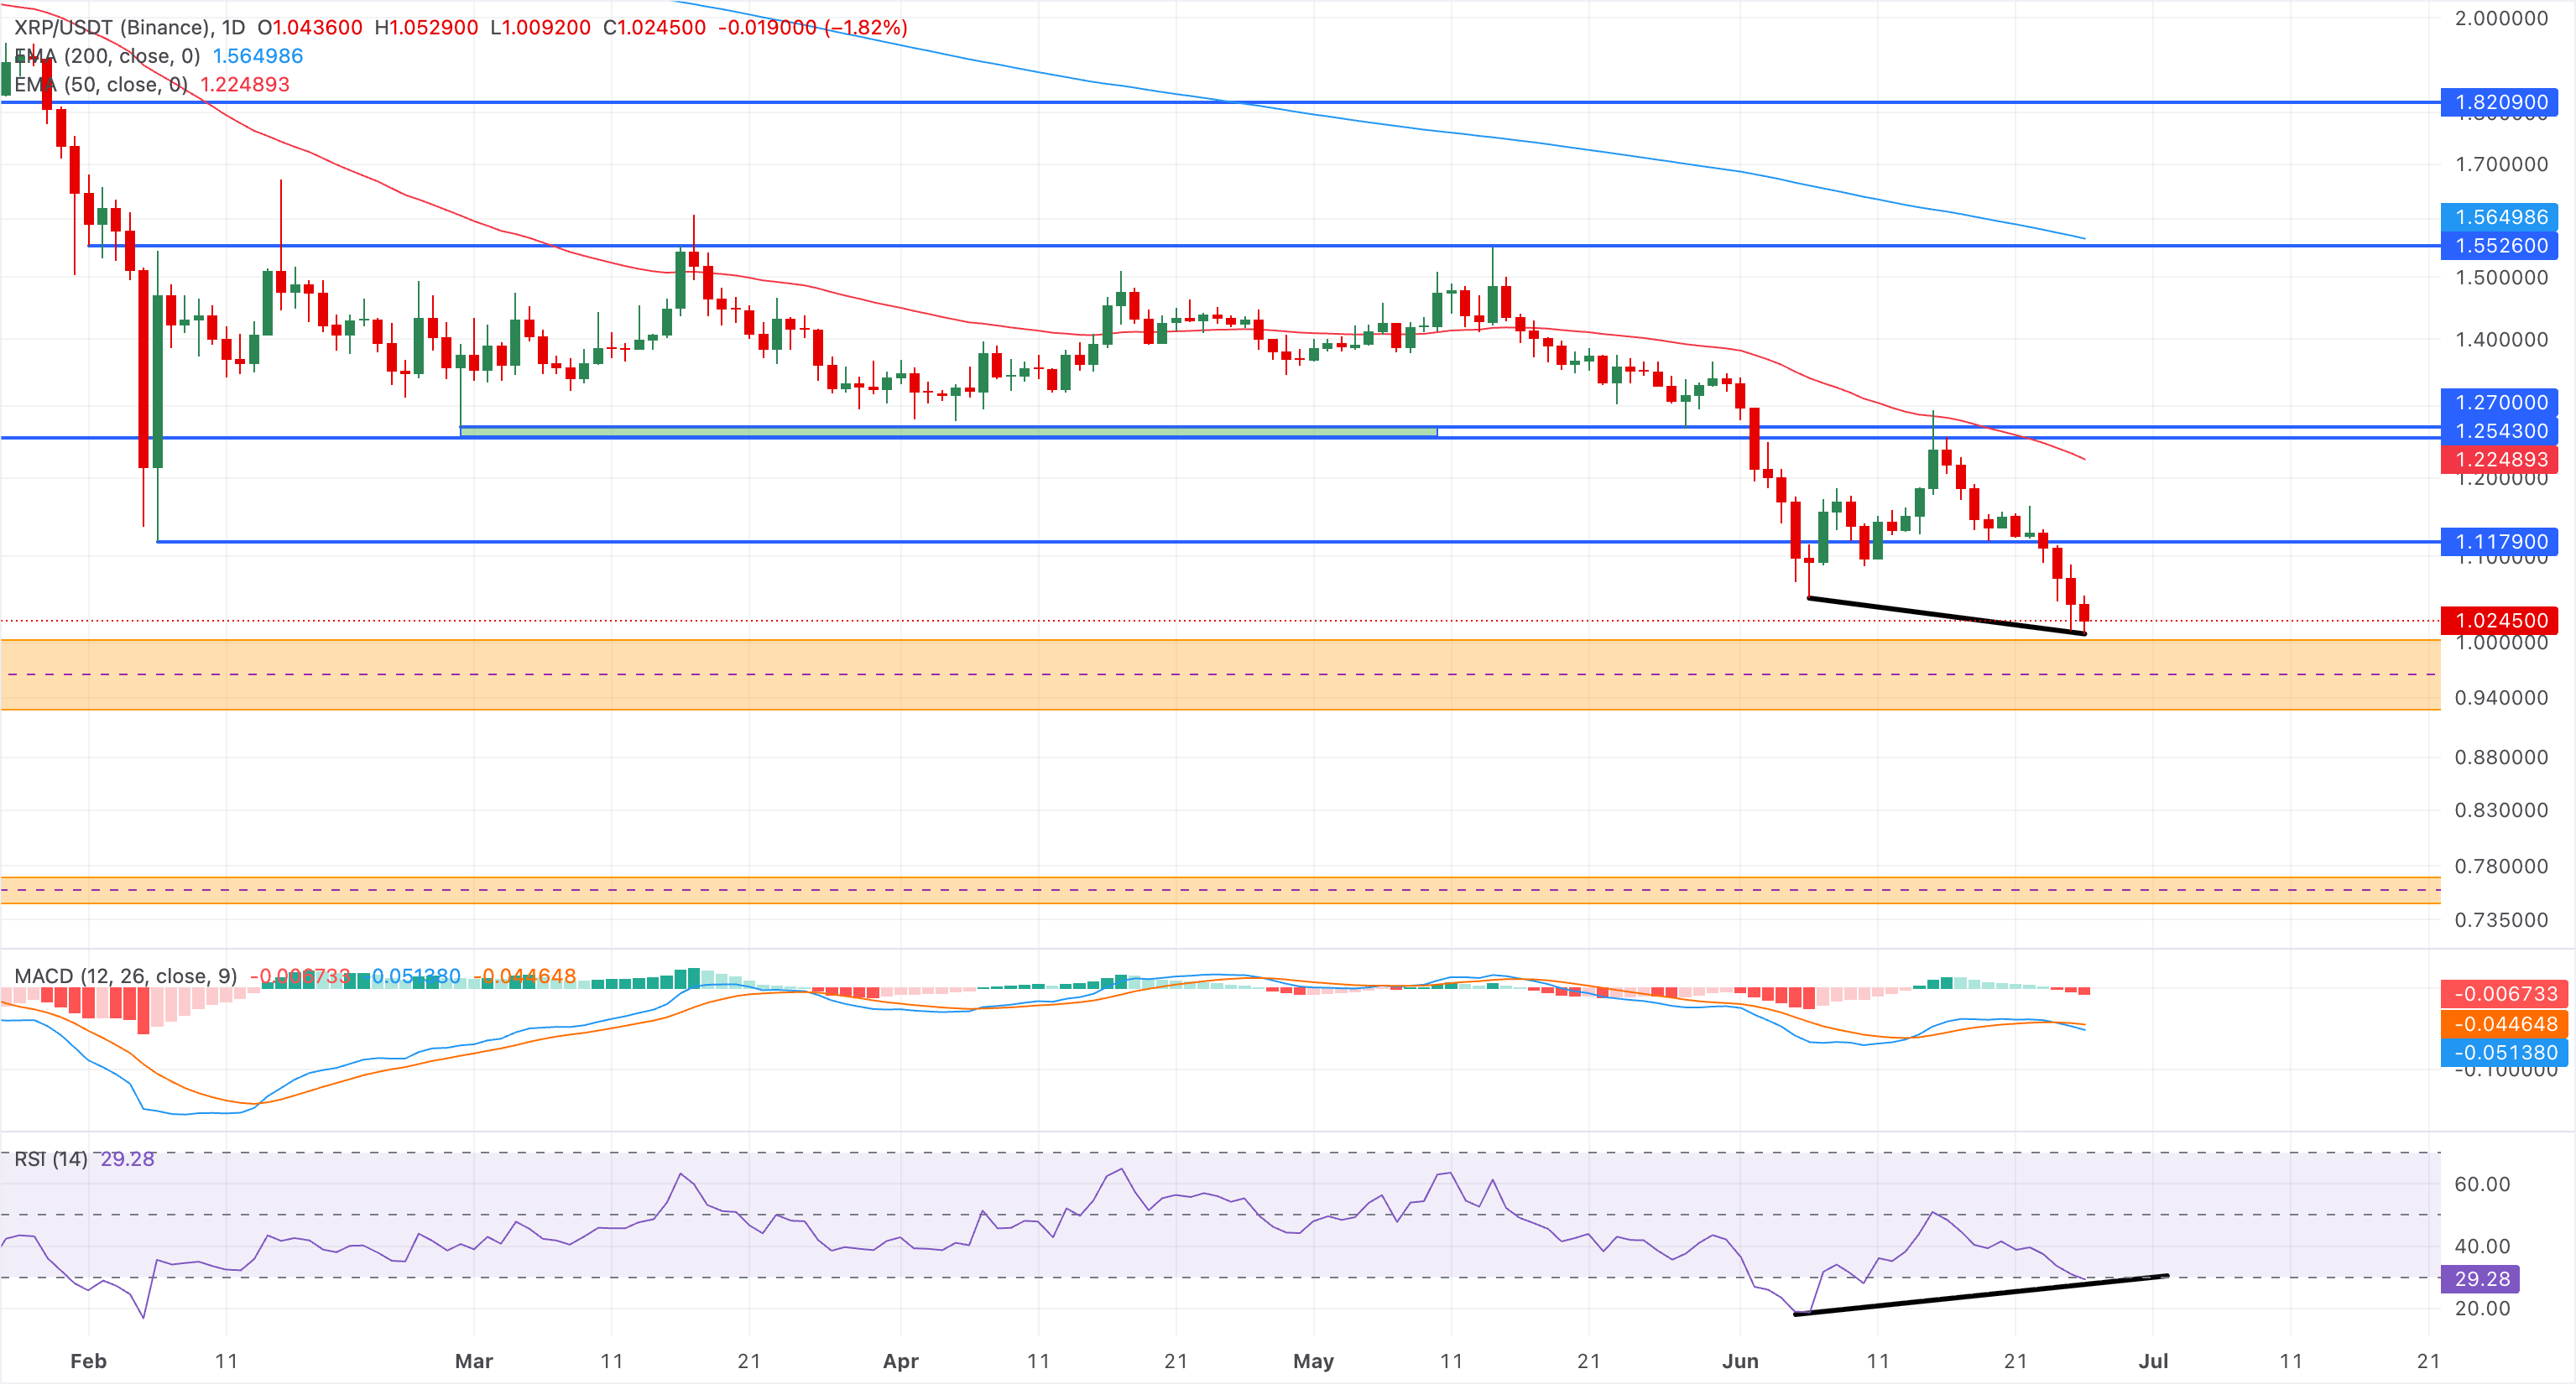
At the time of writing, Ripple is trading around $1.03, continuing its downward trend since the 50-day EMA halted its recovery at $1.28 on June 15. XRP’s retreat is now approaching the psychological support level of $1.00, which sits within a Fair Value Gap (FVG) between $0.92 and $1.00.
The repeated rejection of higher prices in daily trading indicates slight dip-buying interest, while the RSI signals clear bullish divergence, suggesting a possible double-bottom rebound. Nevertheless, the MACD is currently below its signal line, indicating a short-term bearish outlook.
On the upside, if XRP can rise above the February 6 low of $1.11, it might extend its recovery toward the 50-day EMA at $1.22.
Conversely, a daily close below $1.00 could trigger a more severe correction toward the lower FVG support at $0.92, followed by another FVG around $0.77.
(This technical analysis was produced with the assistance of an AI tool.)