

Bitcoin (BTC), Ethereum (ETH), and Ripple (XRP) are witnessing impressive rallies as market optimism grows, largely fueled by the US Treasury’s announcement to double its debt buyback initiatives. This week, BTC has surged nearly 20%, ETH has increased by over 25%, and XRP has jumped close to 30%. With positive momentum indicators and essential technical levels suggesting further growth, attention now turns to whether BTC can hit $80,000, ETH can reclaim $2,500, and XRP can rise toward $1.50.
BTC Approaching $80,000
Bitcoin’s price is trading at $74,700 on Friday, following a breakout above significant Exponential Moving Averages (EMAs) and exhibiting a strong bullish short-term outlook. The 50-day, 100-day, and 200-day EMAs, positioned at $65,286, $66,727, and $71,545 respectively, are well below the current price, indicating a solid supporting uptrend following the recent surge in trading volume.
Momentum indicators show strength, with the Relative Strength Index (RSI) in the overbought zone around 83. Meanwhile, the Moving Average Convergence Divergence (MACD) remains convincingly positive, signaling ongoing bullish pressure, although there could be some vulnerability to short-term corrections.
On the upside, immediate resistance is identified at the psychological level of $80,000, where increased supply may moderate the rally and lead to consolidation.
For downside movement, initial support is found near the 200-day EMA at around $71,545. Should there be more significant pullbacks, buyers may emerge at the 100-day EMA near $66,737 and a horizontal support level around $66,500. Deeper corrections would see critical support levels at the 50-day EMA around $65,286 and a structural floor at $62,300, which are essential to maintain the overarching bullish trend.
Ethereum Bulls Driving Momentum
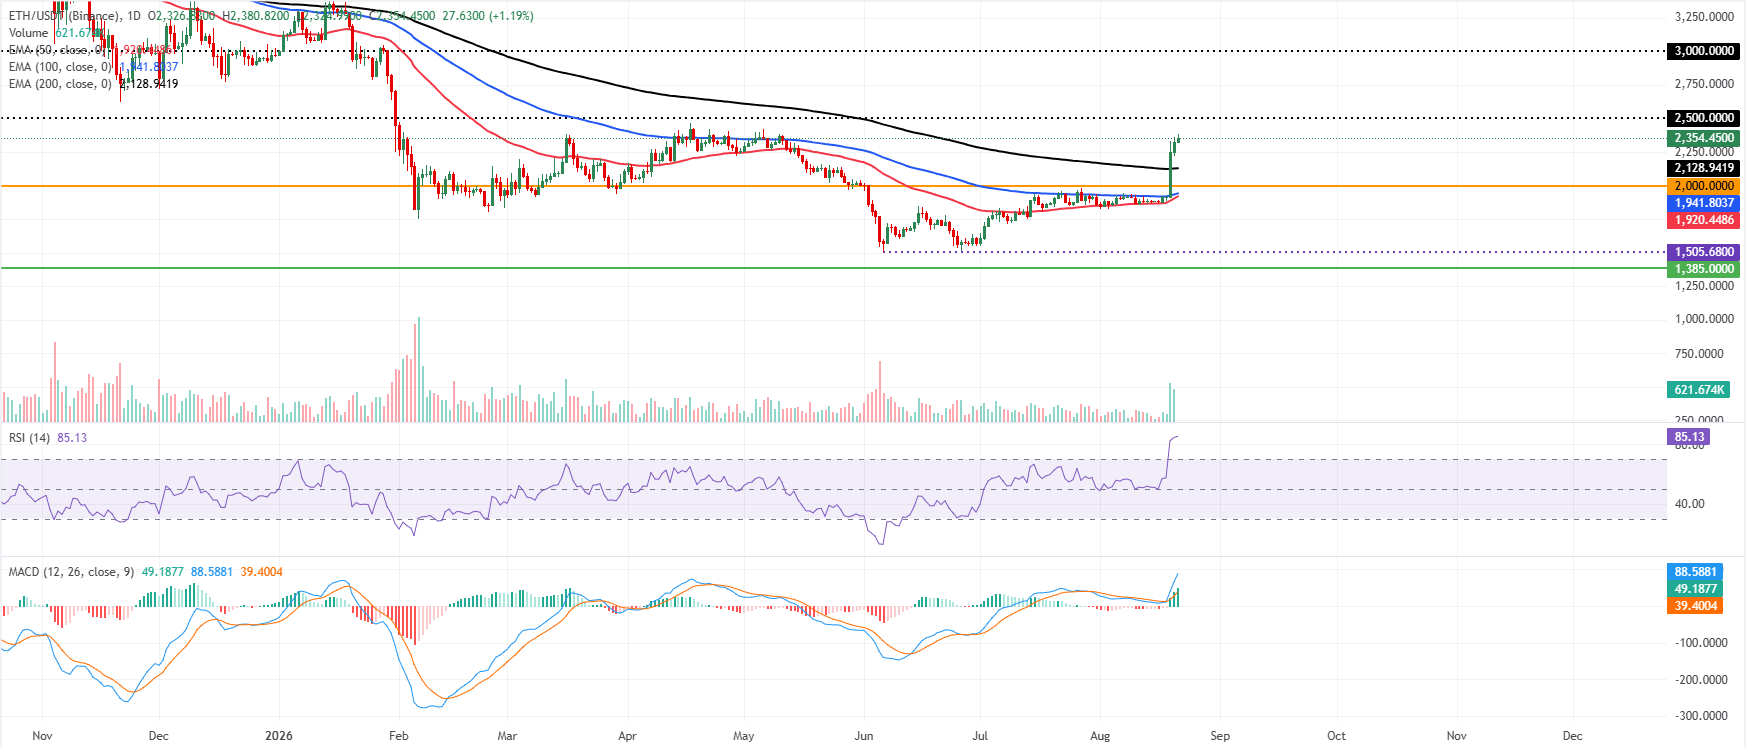
Ethereum’s price stands at $2,354 on Friday, reflecting a steady rise well above key EMAs, which supports a bullish outlook in the near term. The 50-day EMA, 100-day EMA, and 200-day EMA cluster between approximately $1,920 and $2,130, providing a solid foundation as the price nears a critical resistance level at $2,500.
Momentum indicators are elevated, with the RSI around 85 in overbought conditions and the MACD in strong positive territory, indicating strong upward momentum, though there may be a risk of overextension.
On the upside, the first resistance level is at the key psychological mark of $2,500, with a further cap anticipated at $3,000, where buying interest might start to diminish.
For downside potential, immediate support is present around the recent price level, alongside stronger support at the 200-day EMA near $2,128 and the $2,000 mark. Additional corrective movements could seek support at the 100-day EMA near $1,941 and the 50-day EMA at approximately $1,920.
XRP Gains Nearly 30%
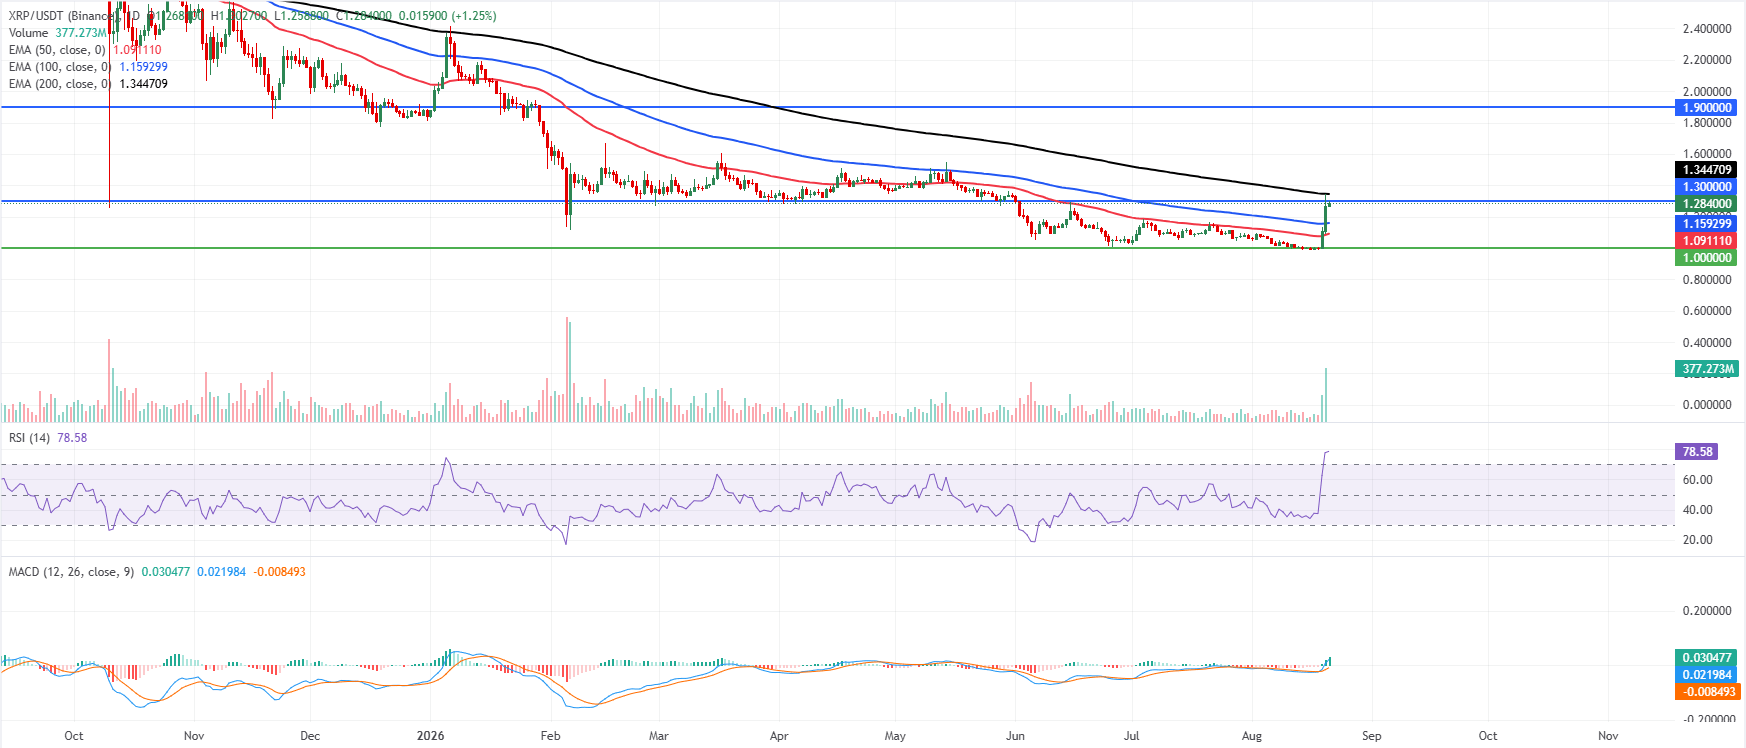
XRP is currently priced at $1.284 on Friday, marking an increase of nearly 30% this week. The XRP market maintains a positive near-term tone as it stays above the 50-day and 100-day EMAs at $1.091 and $1.159, respectively, while it still faces resistance from the 200-day EMA at $1.344.
The RSI at 78 indicates overbought conditions, and the MACD shows a strong bullish stance in positive territory, suggesting robust upward momentum but a potential risk of a pullback if buyer enthusiasm diminishes near resistance levels.
For upward movement, immediate resistance is observed around $1.300, followed by the 200-day EMA at $1.344, with a further barrier around $1.900.
On the downside, initial support can be found at the 100-day EMA near $1.159, followed by the 50-day EMA at $1.091. A more remote support level exists near $1.000, indicating a crucial structural floor.
(This technical analysis was assisted by an AI tool. Learn more.)