
On October 13, the cryptocurrency market continued its downward trend, with Bitcoin slipping below $82,000. Other digital currencies, notably Ethereum, also experienced declines.

Contents
Why Are Bitcoin and Ethereum Leading Today’s Market Decline?
For those questioning why cryptocurrencies are facing a downturn today, the increasing number of liquidations and a decrease in demand for digital assets can clarify the current selling trend.
Bitcoin Price Declines Below $83,000 Amidst Market Contraction
As reported by The Block, Bitcoin dropped by 2.8% in the last 24 hours, settling around $81,382 as of October 12. Other digital currencies followed suit, contributing to the broader wave of leveraged position liquidations.
This current decline in Bitcoin prices signifies an overarching weakness in the crypto market. On October 13, Bitcoin continued to face challenges, according to The Economic Times.
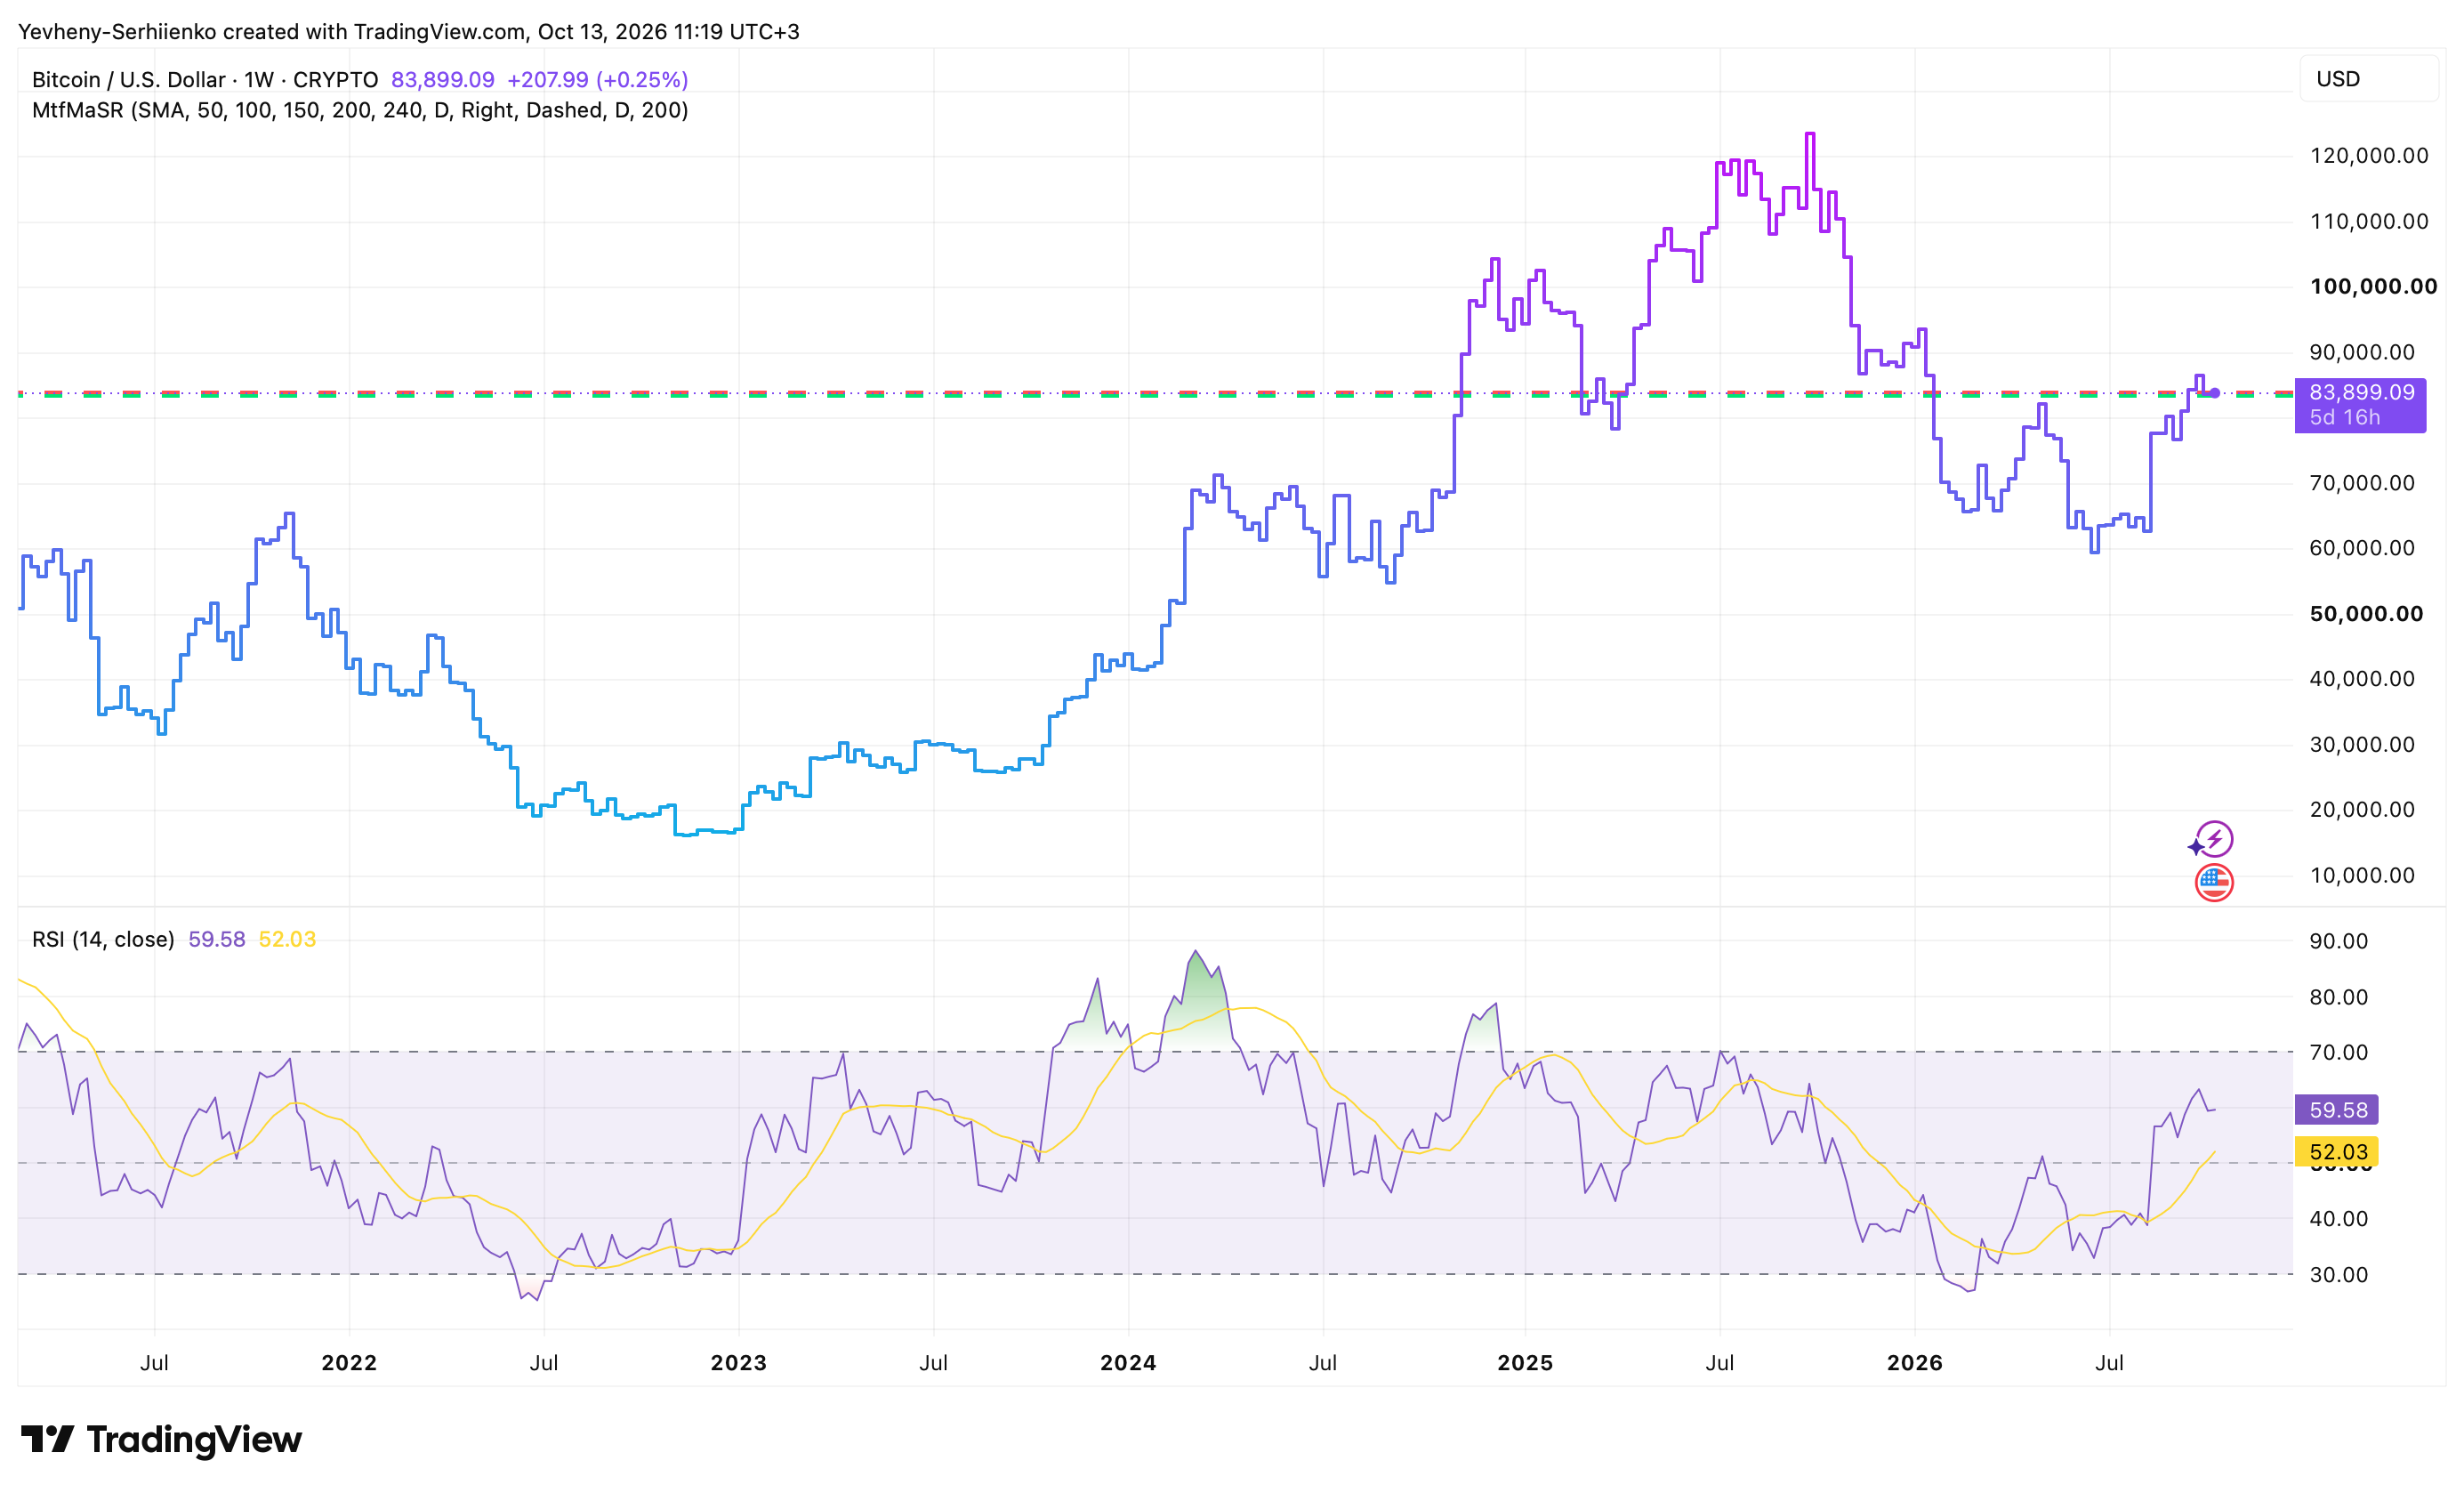
Steeper Declines for Ethereum, Solana, XRP, and Zcash
Traders may wonder why Ethereum saw a downturn today, as its price fell to $2,425 on Monday, aligning with increased selling pressure affecting Solana, XRP▼$1.16, and other prominent cryptocurrencies. On October 13, Solana decreased by around 4.5%, while XRP dropped about 3.5% as reported by the trading data.
Notably, Zcash experienced a significant decline, with its price dropping by 10.4% to $1,149. According to The Block’s data, Zcash’s dip highlights the widespread impact of the market sell-off on cryptocurrencies beyond just Bitcoin.
Read More: Bitcoin and Ethereum ETFs Reverse Course With $1.22 Billion in Weekly Outflows
Current Crypto Market Overview: Key Gainers and Decliners
As of October 13, the crypto market is dominated by falling prices. The Economic Times tracked several leading cryptocurrencies showing significant decreases: Zcash plummeted over 9%, Hyperliquid dropped around 6.3%, and Solana fell approximately 4.5%.
Protective assets underperformed, while Bitcoin and TRON showed relatively stable price movements compared to other cryptocurrencies. Overall, the market shows a downward trend, although some differences exist in asset performance.
$771 Million in Crypto Liquidations: Reasons for Bitcoin’s Sell-Off

The recent sell-off of Bitcoin triggered a wave of liquidations in cryptocurrency derivatives. As reported by The Block, around $771 million in crypto liquidations occurred in the 24-hour period ending on October 12, when Bitcoin’s price momentarily dipped below $82,000 according to CoinGlass data.
$685.6 Million Liquidated from Long Positions in 24 Hours
Traders holding bullish positions suffered the most losses, with total liquidations amounting to $685.6 million from long positions, representing nearly 89% of the total liquidations. This highlights the risks that leveraged traders face during Bitcoin’s declining period.
Liquidations intensified in the last 12 hours of the reporting period, accumulating $631.8 million, which comprised $600 million from long positions, according to figures from The Block.
Understanding How Leveraged Crypto Trading Amplifies Price Drops
Leverage allows traders to control larger amounts of an asset while utilizing limited capital. However, this strategy carries risks, including forced liquidation, whereby an exchange liquidates a trader’s position to mitigate losses when prices start to decline.
Such forced liquidations can exacerbate market volatility, creating increased downward pressure. A report from Crypto Briefing indicated that roughly $120 million in long positions were liquidated within 15 minutes when Bitcoin dropped below the $82,000 threshold.
Bitcoin Liquidation Levels: Where Could Selling Pressure Persist?
Bitcoin’s current liquidation metrics indicate a bearish market stance. On October 13, a liquidation heatmap from Alpha Finance revealed a significant concentration of approximately $98.6 million in long liquidations at $82,632. Additional clusters appeared at $81,946 and $81,604.
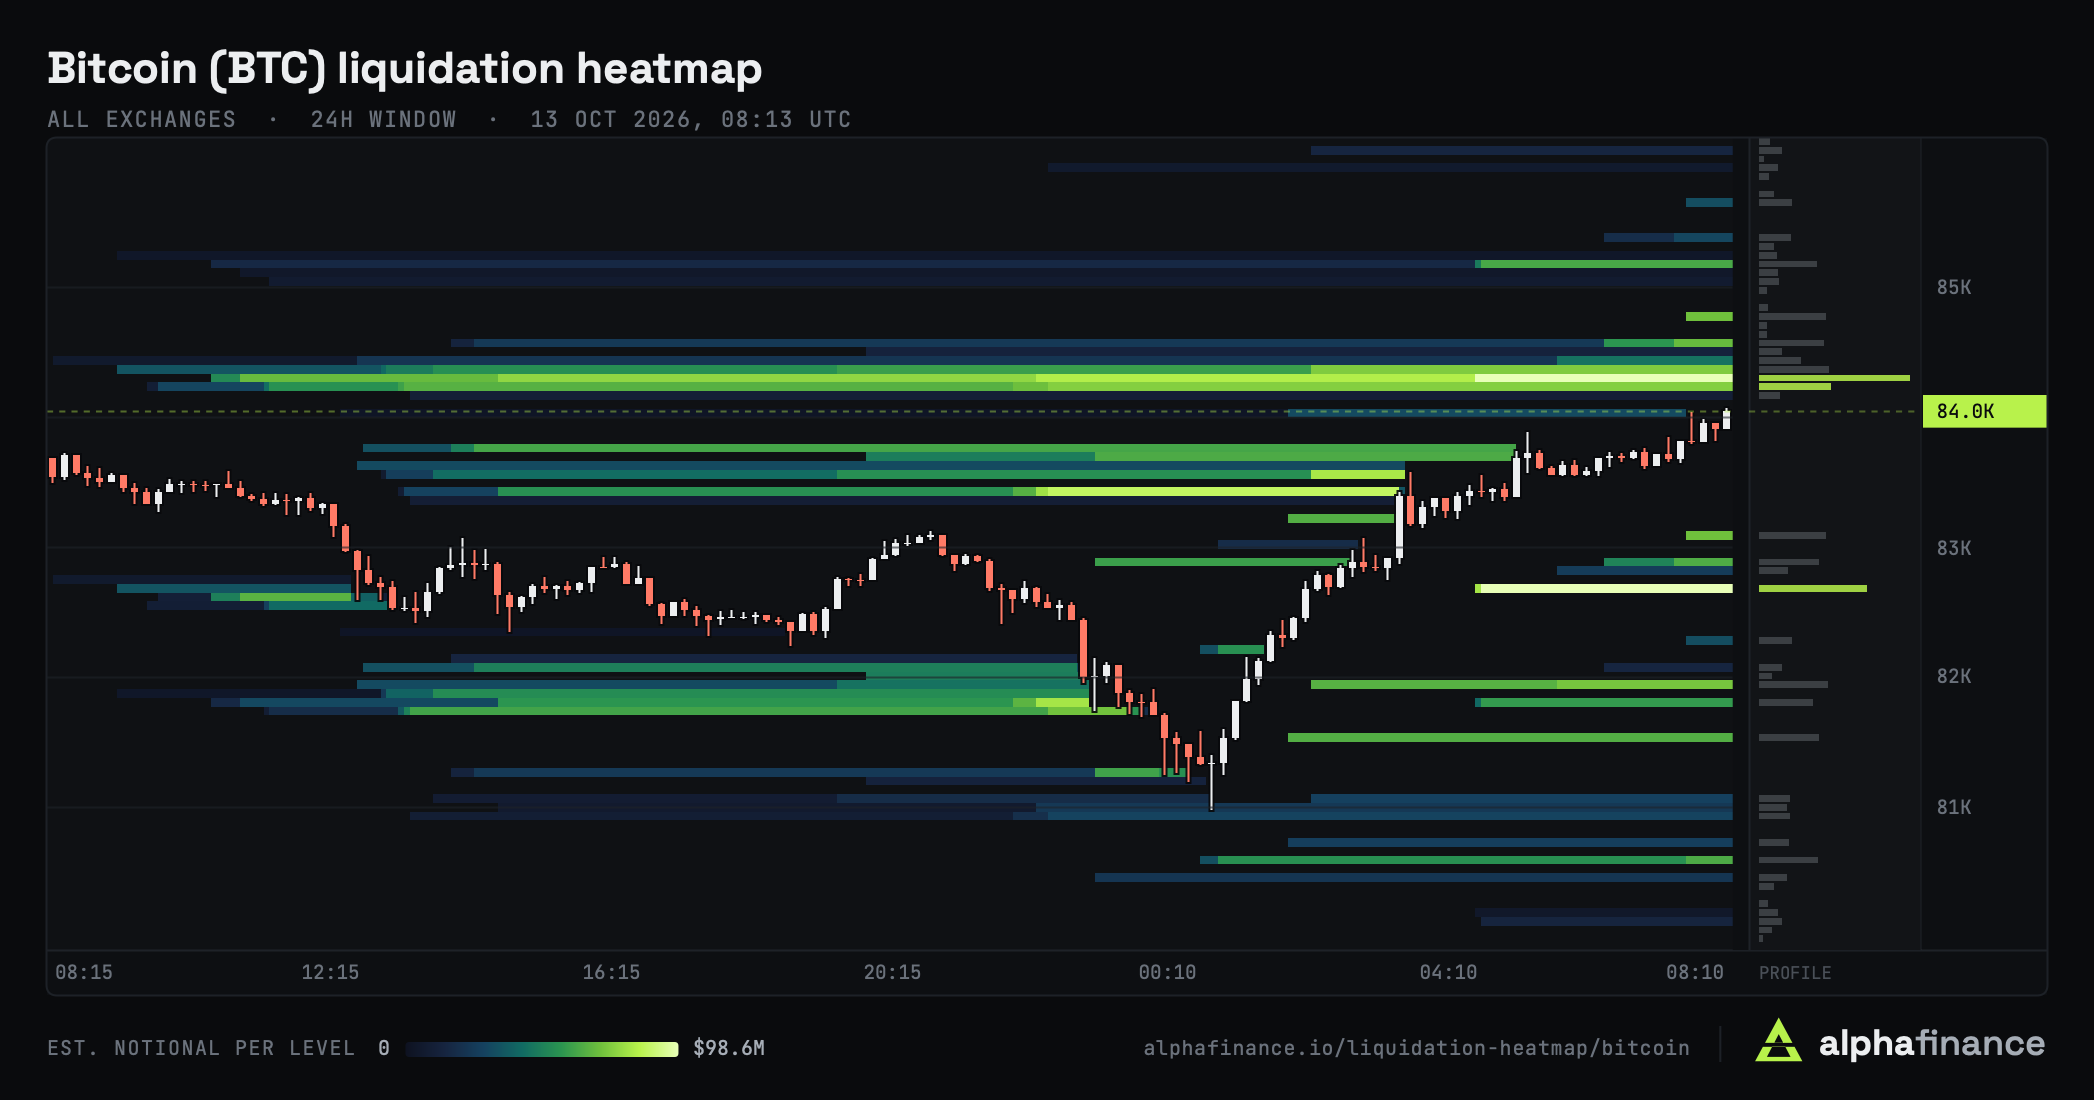
Additional liquidation clusters were noted at prices of $80,575 and $80,163. It’s essential to understand that these figures represent exposure to liquidation, not actual buy or sell orders. Individual liquidation prices for traders may vary based on their leverage and margin policies.
Why Is Bitcoin Declining? Three Key Factors Behind the Market Crash
The reasons behind Bitcoin’s drop today involve more than just leveraged liquidations; other contributing factors include fund withdrawals, surging U.S. borrowing costs, and a slump in Asian equity markets. Overall, market participants are showing increased risk aversion.
ETF Outflows Indicate Weak Institutional Demand for Bitcoin
Recent data from Farside Investors shows that U.S.-listed Bitcoin ETFs experienced $679 million in withdrawals for the week ending October 9. These outflows reversed the trend of the previous week and demonstrate weak institutional interest.
On October 12, outflows continued with $65.4 million being withdrawn from BlackRock’s IBIT ETF. Such trends do not bode well for overall demand from institutional investors.
Pressures from U.S. Treasury Yields and the Dollar on Risk Assets
The surge in interest rates and a strong U.S. dollar have negatively impacted the cryptocurrency market. Bitcoin’s price fell last week amid rising Treasury yields and a strengthening dollar, which fueled fears over increasing inflation and actions by the Federal Reserve.
As of October 13, the dollar hovered near an 18-month high. The yield on U.S. 10-year Treasuries dropped to approximately 5.19%, partly due to a shift towards safer assets, according to Reuters.
Read More: Why Are Ethereum and XRP Prices Falling While ETF Investors Treat Them Differently?
Declines in South Korea’s Stock Market Contribute to Crypto Market Anxiety
On October 13, South Korea’s KOSPI index dropped 5.46% to 6,035.35 amid weakness in chip stocks. Foreign investors offloaded about $3.35 billion in South Korean equities, prompting emergency measures by the Korea Exchange to mitigate offshore sales.
This decline reflects concerns about disappointing returns from technology investments, especially in AI, and heightened competition in the semiconductor sector. The broader sell-off in Asian tech stocks exacerbates the concerns around the crypto market, as reported by Reuters.
Current developments highlight growing unease about global risk appetite and uncertainty within financial markets. However, no direct connection has been established between the declines in South Korean stocks and Bitcoin prices.
| Market Factor | Key Data | Impact on Bitcoin |
| Bitcoin ETF Outflows | $679M withdrawn in the week ending October 9 | Indicates weaker ETF demand and potential selling pressure |
| U.S. Treasury Yields and Dollar | 10-year Treasury yield at 5.19%; dollar near 18-month highs | Higher borrowing costs and reduced appetite for risk assets |
| Sell-Off in South Korean Stocks | KOSPI fell 5.46% on October 13 | Broader market anxiety and weakened investor sentiment |
Bitcoin ETF Outflows Reach $681 Million Alongside $542 Million Loss for Ethereum Funds

In the week ending October 9, both U.S. Bitcoin and Ethereum spot ETFs reported substantial net outflows totaling $1.22 billion. Data from SoSoValue detailed that Bitcoin ETFs faced net withdrawals of $681.1 million, while Ethereum ETFs saw outflows amounting to $542.1 million. Including Solana, these net outflows reached around $1.25 billion.
Why Spotlight on Bitcoin ETF Flows Matters for BTC Pricing
Bitcoin spot ETFs grant institutional and retail investors a regulated avenue to access Bitcoin. Positive net asset inflows into these ETFs could bolster demand for Bitcoin, while significant outflows could induce selling pressure.
The recent outflows indicate a reversal from three consecutive weeks of positive movement. A noteworthy withdrawal of $487.1 million occurred on October 7, although there was a brief recovery with $21.1 million in inflows on October 9. Total net assets stood at $105.84 billion, with cumulative inflows of $57.11 billion since inception.
Ethereum ETF Withdrawals Extend as Solana Funds Experience Negative Trends
Ethereum ETFs have seen outflows amounting to $542.1 million, marking the most significant week of redemptions since January. The trend of losses has continued for nine trading sessions, with total redemptions since September 29 reaching $697.2 million, largely driven by BlackRock’s ETHA fund which accounted for $477 million in redemptions.
Solana ETFs also faced withdrawals of $24.8 million last week, marking the first outflows in 14 weeks, with the Bitwise ETF BSOL contributing $20.9 million—84% of the total outflows. Overall, investor inflows and outflows for Solana ETFs remained positive at $1.58 billion for the duration.
US CPI Report on October 14: Will Inflation Spark Another Bitcoin Sell-Off?

The September consumer price index (CPI) data release is slated for October 14 at 8:30 am Eastern Time. The annual CPI is anticipated to rise from 3.4% in August to 3.7% in September, primarily driven by increasing energy costs. This CPI report could impact expectations regarding the Federal Reserve’s forthcoming interest rate decisions.
Higher CPI Could Pressure Bitcoin Further
An inflation report exceeding expectations could lead to anticipations of continued monetary policy tightening. Rising interest rates often boost demand for interest-accruing assets and diminish interest in riskier investments like Bitcoin.
Understanding how U.S. CPI figures interact with Bitcoin pricing is crucial for analyzing current inflation trends. While many analysts predict the Federal Reserve will maintain current interest rates during its upcoming October meeting, unexpectedly strong CPI readings could alter these expectations.
Read More: TIA Crypto Is Down 97% From Its ATH: Can New Network Integrations Turn Celestia Around?
Lower Inflation Could Pave the Way for Bitcoin Price Recovery
Weaker inflation figures might relieve concerns about potential interest rate hikes. Economists project that core CPI gains will be around 0.2% monthly, suggesting minimal risk of widespread inflation increases despite rising energy costs.
Such an outcome could facilitate a recovery in the crypto market, particularly if Treasury yields and the dollar decline. However, inflation readings alone won’t guarantee a sustained upward trend.
Influences of Federal Reserve Rate Expectations on Crypto Prices
The Federal Reserve’s approach to interest rates significantly shapes market forecasts. Current data on Fed futures indicates a 19% chance of a rate hike in October and an 85% probability for December.
Increased interest rates restrict credit availability, making investments in volatile assets like Bitcoin less appealing. Conversely, expectations of lower interest rates could enhance investor confidence. However, Bitcoin pricing is influenced by numerous market dynamics.
| US CPI Scenario | Federal Reserve Predictions | Bitcoin’s Likely Response |
| Higher Than Anticipated | Increased likelihood of stricter monetary policy | Bearish pressure; risk of further BTC drops |
| Meets Expectations | Minimal shifts in interest rate outlook | Possible stabilizing effects and continued volatility |
| Lower Than Expected | Reduced likelihood of subsequent rate hikes | Improved risk appetite; potential BTC recovery |
Bitcoin Price Prediction: Is BTC Heading Towards $80,000 or Positioning for a Recovery?

Bitcoin’s price remains under bearish pressure leading up to a U.S. inflation report set for October 14. The cryptocurrency was trading at approximately $82,705 as of October 13, according to Reuters.
The price fell close to $80,000 the previous week. Future movements for Bitcoin will primarily depend on bullish efforts to prevent further declines and attempts to breach resistance at $84,000.
Support Levels to Monitor After $83,000 Consolidation
Key support levels for Bitcoin are currently at $82,500 and $81,300. A weekly analysis by Cointelegraph identifies $82,500 as a support point. Bitfinex noted that $81,300 had previously served as resistance, which buyers defended on October 8. Bitcoin’s price had briefly plunged to $80,347 before recovering.
Prolonged trading below $81,300 indicates that a rebound may be unlikely, making the $80,000 threshold critical once again. Furthermore, the True Market Mean index from Bitfinex at $77,400 could provide support if the price continues to decline. A temporary dip followed by a recovery wouldn’t automatically confirm a bearish trend.
What Bitcoin Needs to Confirm a Recovery
For a positive Bitcoin price forecast, the cryptocurrency needs to rise above $84,000 and maintain its position there. According to Bitfinex analysts, the main resistance level lies between $84,000 and $84,500. Additional buying pressure in the spot market will be necessary to sustain a higher Bitcoin price.
Bitfinex’s report from October 12 points to several bullish indicators, including consistent positive ETF sessions and stable positioning in derivatives. If Bitcoin surpasses $84,500, it could potentially rise to $87,722. Bearish pressure is expected from short sellers and bears with significant positions between $86,500 and $87,300.
Read More: USDF vs USDT: Why Traders Are Looking at Falcon Finance’s High-Yield Stablecoin
Bearish and Bullish Scenarios Leading Up to the US CPI Release
In a bearish scenario, an unexpectedly high inflation report alongside renewed ETF withdrawals could push BTC prices below $81,300. Analysts at Bitfinex warn that such developments could negate recent price advances and expose additional downside risks. The base-case price range is projected from $81,300 to $84,500 prior to the inflation data release.
Conversely, a bullish scenario hinges on lower inflation and an uptick in Bitcoin demand. Bitfinex points to a monthly rise of 0.2% or less in core CPI and downgrades in real yields on government securities as catalysts that could lift Bitcoin above $84,500. Continued gains beyond this point would signal bullish sentiment for Bitcoin’s longer-term price trajectory, though both scenarios remain speculative.
Is the Crypto Market Crash a Buying Opportunity or the Beginning of a Deeper Correction?

The recent downturn has brought Bitcoin prices close to previous levels where traders previously bought in. However, recovery potential remains uncertain, as analysts at Bitfinex indicate a need for increased spot demand to facilitate any substantial rebound.
Signs of Easing Selling Pressure
Bitcoin’s rise from the October 8 low of $80,347 is seen as a positive sign. Bitfinex observed diminished leverage in trades and a reduced spread between positive and negative financing rates in Bitcoin perpetual futures. Such a decline in leverage may mitigate the risk of another liquidation wave for Bitcoin.
On October 13, signs showed Bitcoin prices climbing from around $80,953 to $83,281. Multiple tests of support close to $80,000 indicate ongoing demand, although experts advise caution, noting that the correction cannot be deemed complete until Bitcoin exceeds specific resistance levels.
Warning Signs Indicating Potential Further Declines for Bitcoin
Continued ETF redemptions pose significant risks. Bitfinex calculates that the current capital basis for spot Bitcoin ETF holders is $84,340, presenting a potential downward pressure level. Ongoing ETF redemptions could hinder Bitcoin’s ability to recover convincingly.
If Bitcoin sustains a fall below $81,300, it could signal deeper concerns. The next support level is predicted at $77,400 for both ETF and other short-term traders as redemptions persist. Other significant risks include the impending inflation data set to be released on October 14, as increased inflation expectations could complicate ETF performance if tighter monetary policy becomes a reality.
| Market Indicator | Positive Signal | Negative Signal |
| Bitcoin Price Movement | BTC holds above $81,300 | BTC breaks below $80,000 |
| Bitcoin ETF Flows | Inflows resume | Ongoing ETF withdrawals |
| Leverage and Liquidations | Lower leverage and stable funding rates | New long liquidations |
| Key Price Levels | BTC reclaims $84,500 | BTC near $77,400 |
FAQ
What Caused Bitcoin’s Drop on October 13?
Bitcoin prices fell due to $771 million in liquidations across the market, resulting in decreased demand for Bitcoin ETFs and other high-risk assets. On October 12, Bitcoin dipped below $82,000 amid investor caution ahead of the upcoming October 14 inflation report.
Why is the Entire Crypto Market Declining?
The current downturn in the crypto market is driven by leveraged positions being liquidated, fund withdrawals by institutions, and macroeconomic uncertainties. High interest rates coupled with a strong U.S. dollar have led to a risk-averse sentiment among investors. Additionally, falling stock prices in Asian markets are also contributing to the overall decline.
Why Are Ethereum and Other Altcoins Dropping More Severely than Bitcoin?
The decline in altcoins is partly attributed to increased leverage use among these assets. Data from CoinMarketCap indicates that speculative leverage has shifted from Bitcoin to altcoins, augmenting liquidation risks. On October 12, both Ethereum and Solana experienced steeper percentage drops compared to Bitcoin. XRP also underperformed in relation to Bitcoin.
Can Bitcoin Recover From the Current Sell-Off?
There is potential for recovery; however, bearish analysts are closely watching the $86,500 to $87,000 resistance levels. Surpassing these prices may indicate strong demand, while sustained declines below $83,000 could push Bitcoin towards $80,000. New CPI data releases could significantly influence future price movements.
Should You Consider Buying Crypto During a Market Crash?
Investing during a market downturn can offer certain advantages, yet the possibility of further declines presents risks for potential buyers. Evaluating personal financial situations and long-term investment strategies is crucial before assuming that prices will rebound soon. Awareness of ETF dynamics and inflation data is essential for gauging retail interest in specific assets.