
Bitcoin Market Recap: 200-Day Moving Average Reclaimed in Explosive Overnight Surge
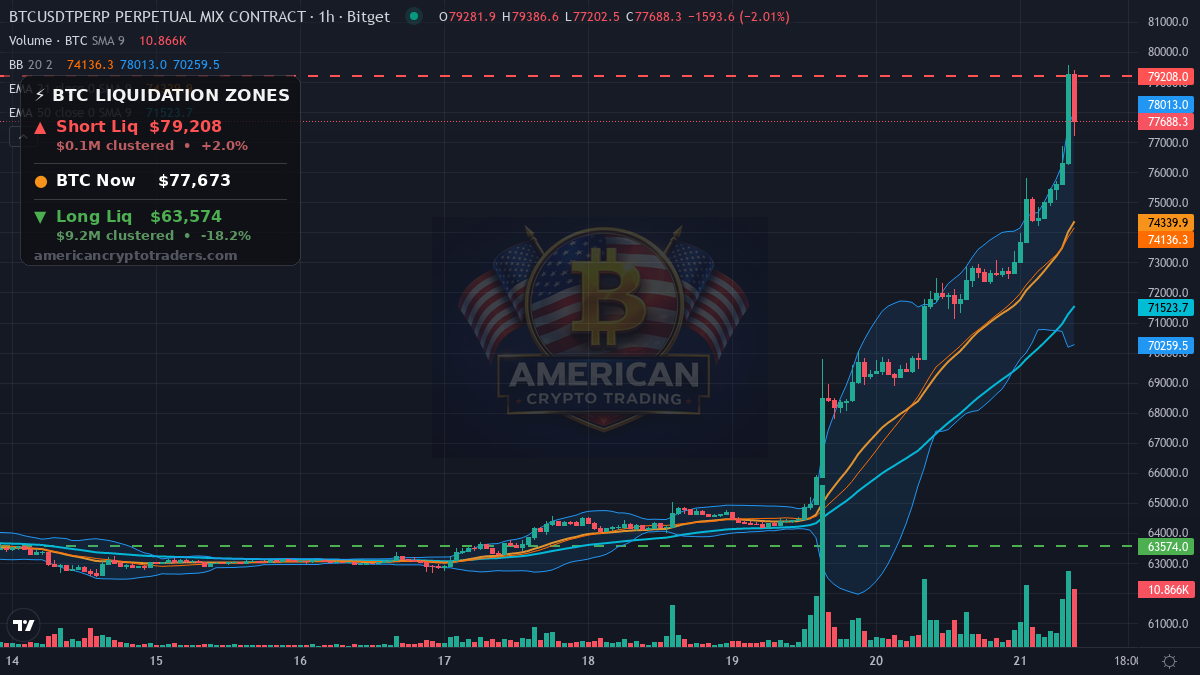
As we gear up for the New York session, Bitcoin currently sits at $77,707, up 8.25% over the past 24 hours after an explosive overnight run through Asia and London that saw price rip from a low of $71,111 all the way to a session high of $79,576 before pulling back modestly. That move printed one of the more technically significant candles of the year, and the question now is whether NY desks arrive with conviction enough to push through the overnight highs. This bitcoin market recap breaks down everything that drove the overnight action and what to watch as the U.S. cash open approaches at 9:30 AM ET.
What Moved Markets Overnight
Bitcoin reclaimed its 200-day moving average for the first time since November, triggering a cascade of momentum buying and short liquidations. The 200-day MA is one of the most widely watched technical levels in markets — institutional algorithms and discretionary traders alike treat it as a dividing line between bull and bear regimes. Once price punched through decisively, systematic buyers stepped in and forced overleveraged shorts to cover, creating a feedback loop that accelerated the move from $71,111 to $79,576 on volume of over $7.68 billion in 24 hours. That kind of momentum is not noise; it is a structural shift in positioning.
Bitcoin ETFs pulled $608 million in inflows, while Ether ETFs posted their largest single-day inflow since October — confirming institutional demand as a core driver behind the overnight surge. These are not retail traders clicking buy on a phone app; ETF flows of this magnitude represent deliberate allocation decisions made by portfolio managers and family offices. The Ether ETF data point is particularly notable because it suggests the bid is broadening beyond Bitcoin, even as BTC dominance holds firm at 59.6%. Institutional buyers chasing this breakout is a materially different setup than a retail-driven pump.
The macro backdrop provided meaningful tailwinds, with Gold up 2.98% to $4,650 and the DXY sliding 0.31% to 98.59 — classic signals of dollar weakness and a flight toward hard, scarce assets. Bitcoin has increasingly traded alongside gold as a macro hedge, and this correlation held overnight. However, S&P 500 futures are down 0.87% ahead of the cash open — a divergence worth monitoring closely. If equity weakness deepens into the NY open, it could dampen risk appetite and create friction for Bitcoin even as the technical setup remains bullish. The 10-year Treasury yield ticking up 0.92% to 4.70% adds another layer of complexity heading into the session.
Altcoin Action
ENA is the undisputed overnight standout, surging 50.4% on what appears to be a news-driven catalyst. Moves of that magnitude in a single session are almost always tied to a specific event — protocol news, partnership announcement, or listing — rather than pure BTC beta. Traders should treat it with caution; news spikes of this size are prone to sharp mean reversion once the initial catalyst is absorbed.
BTW posted a 27.3% gain, making it the second-largest mover in the session. DOGE is up 8.73%, essentially tracking BTC beta as it tends to do during broad-market rallies, touching a high of $0.08575 before pulling back to $0.08347. ETH is holding $2,388, up 4.62%, with a 24-hour high of $2,449. SOL added 4.2% to trade at $91.19, touching $93.44 at the session peak.
Both ETH and SOL are gaining in dollar terms but clearly underperforming Bitcoin on a percentage basis, which explains why BTC dominance remains sticky at 59.6%. When Bitcoin is making a structural technical breakout, capital tends to concentrate in BTC first. An altcoin rotation typically follows if the BTC move consolidates and holds — but that confirmation has not arrived yet. On the downside, LIT is the worst performer at -4.5%, with M off 3.0%.
Positioning and the Liquidation Map
Despite the magnitude of the overnight move, BTC funding rates are sitting at a remarkably calm 0.01%. That tells a critical story: the market has not yet become crowded with leveraged longs chasing the breakout. In past rallies where funding spiked to 0.05% or higher on a large move, those setups often resolved with sharp pullbacks as over-leveraged positions were flushed. The current neutral funding reading suggests this move has room to breathe without an immediate squeeze in the opposite direction.
The liquidation map is straightforward heading into the NY session. Short liquidations are clustered at $79,208 — just a 2.0% push from current prices. Bitcoin already tagged $79,576 overnight, meaning some of those shorts were already pressured, but a clean sustained break above that level on the NY open would force the remaining clustered shorts to cover and could provide another leg higher. On the downside, long liquidations are stacked at $63,574 — roughly 18.2% below current price. A move to that level would be a severe breakdown and would require a dramatic change in market structure; it is not the base case given overnight momentum, but it defines the risk of a failed breakout.
The Macro Picture
The dollar weakness narrative is the most important macro thread running through this session. A DXY at 98.59 and declining is historically supportive of risk assets and hard-money plays — Bitcoin and gold are both benefiting from that dynamic simultaneously. Gold at $4,650 is itself at an extraordinary level, and the two assets moving together overnight reinforces the thesis that this is a macro allocation shift, not just a crypto-specific trade.
The equity divergence is the wildcard. S&P 500 futures down 0.87% going into the cash open means that when NY desks arrive at 9:30 AM ET, they will be managing a split screen — a crypto market ripping higher while equities are under pressure. That divergence is unusual and could resolve in either direction. If equity weakness deepens, some risk-off rotation could bleed into crypto. If stocks stabilize, Bitcoin holding above the 200-day MA would look increasingly constructive.
Levels to Watch
The immediate level to watch into the NY open is $79,208–$79,576 — the short liquidation cluster and the overnight high form a tight resistance band. A sustained move through that zone on volume would signal that NY buyers are willing to extend the breakout and could open a run toward higher targets. Failure to reclaim it keeps Bitcoin in a consolidation band just below a key technical area.
On the support side, the 200-day moving average itself becomes the first line of defense. Bitcoin spent months below this level; traders will be watching closely to see if it now acts as support on any pullback. Below that, $71,111 — the 24-hour low — marks the base of the overnight breakout range and the last meaningful support before the picture changes structurally.
Upcoming Catalysts
The economic calendar is relatively quiet heading into today’s session, with no major scheduled macro data releases present in this morning’s data. The primary catalysts will be price-action driven — specifically whether the NY open brings volume confirmation of the overnight breakout or a fade.
Sentiment Check
The Fear & Greed Index is reading 72 — Greed. That is a meaningful step up and reflects the overnight move, but it is not yet at the extreme greed levels (80+) that have historically signaled near-term exhaustion. There is still room for sentiment to expand before the contrarian signal flashes. That said, traders should be aware that sentiment can shift quickly when funding is neutral and a large move has already occurred — any rejection at overhead resistance could cool sentiment fast.
For a longer-term perspective on where Bitcoin stands in its cycle, our 28-for-28 monthly candle analysis remains one of the most reliable frameworks we track for understanding broader trend structure.
Bottom Line
Bitcoin’s reclaim of the 200-day moving average is the most technically significant development in months, and the ingredients behind the move — institutional ETF inflows, macro dollar weakness, and neutral funding — give it credibility. This does not look like a liquidity-thin fake-out; it looks like a real structural shift that could set the tone for the weeks ahead.
The immediate test is whether NY buyers show up to defend and extend the overnight gains or whether the equity weakness and overhead resistance at $79,208 cause the rally to stall and consolidate. Watch volume into the cash open. A high-volume hold above $77,000 with a push toward $79,576 would be the bull confirmation. A rejection on low volume with a drift back below $76,000 would suggest this breakout needs more time before it runs further.
Disclaimer: This recap is for educational and informational purposes only and does not constitute financial advice. Cryptocurrency trading involves substantial risk of loss. Always do your own research. American Crypto Traders and its contributors may hold positions in the assets discussed.
Originally published on American Crypto Traders
This article was syndicated from the American Crypto Traders daily brief. For original analysis and trading signals, visit americancryptotraders.com