

Source: Ali Charts
Utilizing this fractal suggests that the upcoming resistance level is the May 2026 peak of approximately $83,000. A downward correction could present a valuable buying opportunity ahead of the next upward movement. Overcoming this threshold will be challenging, as multiple indicators illustrate its significance as a resistance area.
The first indicator to consider is the UTXO Realized Price Distribution (URPD), which indicates that close to 975,000 $BTC were obtained in the price range of $83,307 to $84,569. This highlights the area as a key supply barrier that must be surpassed before any significant price increase.
The second indicator involves the profit margins of on-chain traders, currently sitting at 25%. In the last year, such figures typically led to increased selling pressure due to profit-taking, provoking short-term price drops. Notably, whales seem to have capitalized on this, recently realizing approximately $88 million in profits.
What’s next?
If the selling pressure continues, the following main resistance levels can be found between $76,996 and $78,258, and subsequently at $63,111, as indicated by the URPD chart.
While this scenario appears concerning, it could provide an excellent buying opportunity. However, maintaining a daily and weekly closing above $80,000 would strongly confirm bullish divergence.
Fundamental analysis
Last week, spot Bitcoin ETFs saw inflows of around $2 billion, marking the strongest single-week performance in the last ten months.
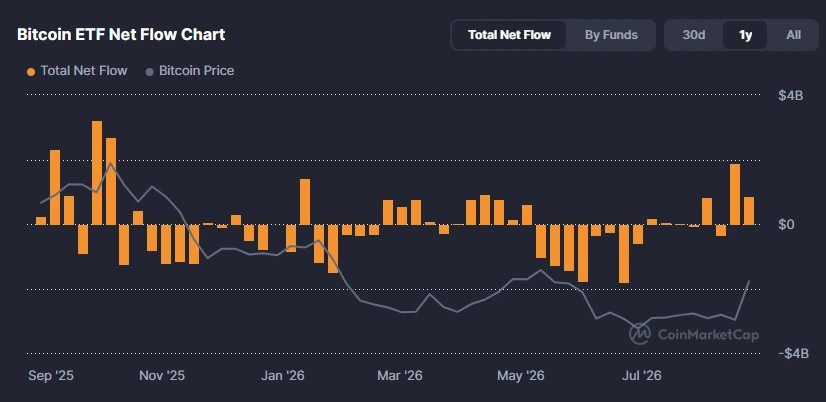
Source: CoinMarketCap
This surge in inflows has contributed to the recent upward price movement, with further increases anticipated following the vote on the September CLARITY Act.