
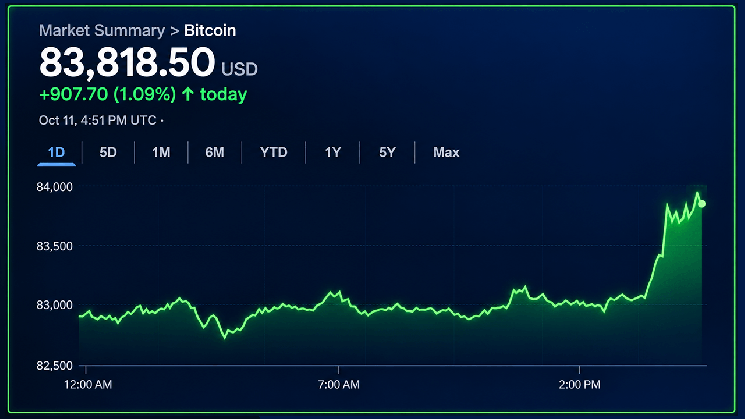
Resistance levels hovering between $83,900 and $84,200 continue to act as a significant barrier, and the most recent price movements have not yet confirmed a stable position above this range. A breakthrough past $84,000 would shift attention toward $84,800, whereas further struggles could drive bitcoin back down to $83,300 and potentially $83,000.
Four-Hour Chart Signals Potential Improvement
On the four-hour chart, there are signs of a favorable trend, with a succession of higher lows indicating a gradual reduction in bearish sentiment since bitcoin dipped from $86,677. Still, the recovery is not yet thoroughly established, especially as it faces resistance around the $84,000 mark.
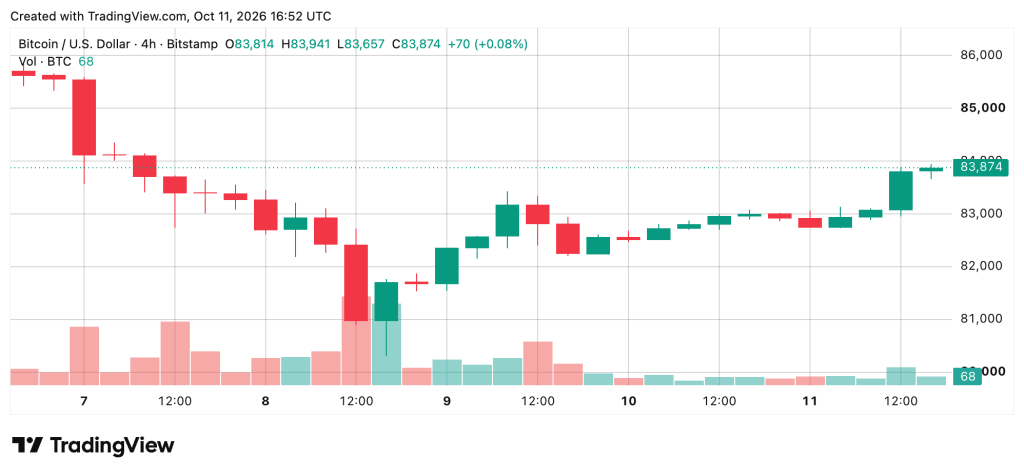
Maintaining levels between $83,000 and $83,300 would help sustain the current recovery structure, but a pullback below $82,500 could lead to targets around $81,500. At this moment, while the four-hour dynamics indicate better conditions, they do not confirm a full bullish reversal, as momentum still needs validation to support the price rebound.
Daily Chart Highlights the Larger Context
The daily chart presents a more nuanced scenario, revealing that bitcoin remains below its recent peak of $87,374, even after rebounding from the $81,000 area. The ongoing series of lower highs has not been decisively broken, exposing the market to potential downward movements if resistance persists.
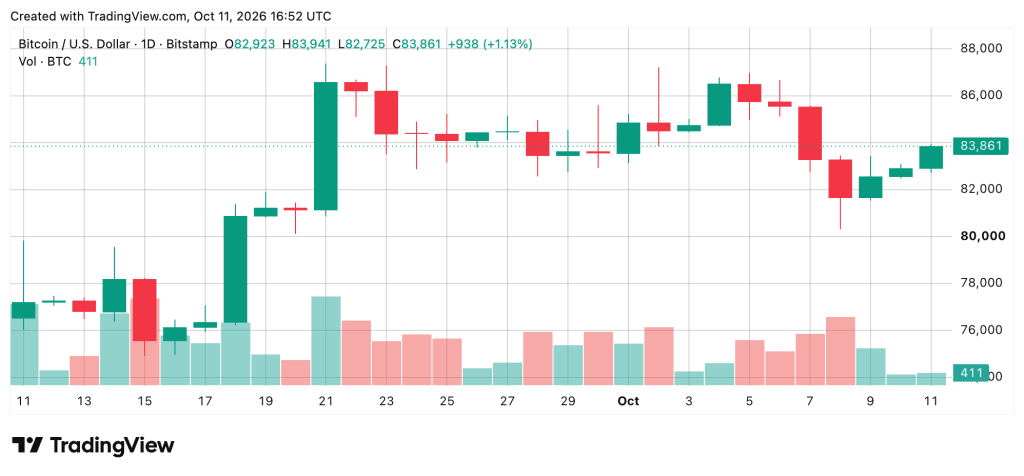
Nevertheless, bitcoin’s position above several long-term moving averages indicates that the foundational structure hasn’t severely weakened. Immediate support is represented around $82,735, followed by the $82,500 mark. A deeper drop towards $80,900 could further strain medium-term predictions.
Oscillators Reveal Bitcoin’s Momentum Challenges
Oscillator indicators on the daily chart are mostly neutral, with the relative strength index (RSI) at 52 and Stochastic at 37. The commodity channel index (CCI) is recorded at -94, while the average directional index (ADX) shows a reading of 33, suggesting notable trend strength without a clear directional bias.
The Awesome oscillator (AO) shows a reading of 944, though with momentum at -1,832 and the moving average convergence divergence (MACD) at 863 registering negative signals. Additionally, the Stochastic RSI fast indicator stands at 20, with Williams at -61, the Ultimate oscillator (UO) at 42, and bear-bull power at -1,158. Collectively, these metrics imply that bitcoin’s recovery has not yet established strong momentum confirmation.
Moving Averages Indicate Market Division
The moving averages (MAs) present a particularly intriguing contrast. Bitcoin is trading above its 10-period exponential moving average (EMA) at $83,503 and the 20-period EMA at $83,193, yet lies below the 10-period simple moving average (SMA) at $84,052 and the 20-period SMA at $84,199.
The 30-period EMA at $82,253 and SMA at $82,472 provide additional support, while the 50-period EMA at $79,993 and SMA at $80,928 help to bolster the longer-term positive outlook. The 100-period and 200-period averages also remain well below market levels. Meanwhile, the volume-weighted moving average (VWMA) at $84,164 poses further immediate resistance, placing bitcoin in a complex situation between emerging support and persistent overhead obstacles.
Bullish Perspective:
As long as bitcoin stays above $83,000 this weekend, its recovery appears promising, particularly with the 10-period and 20-period EMAs offering essential support. A consistent climb past $84,200 would strengthen bullish arguments and potentially pave the way toward $84,800 and $85,500. Surpassing these thresholds could prompt a re-evaluation of the previous high of $86,677, although stronger momentum confirmation is necessary for a compelling case.
Bearish Perspective:
The failure to break through the resistance zone of $83,900 to $84,200 puts the recovery at risk for potential declines. A drop below $83,000 would undermine the immediate structure, while falling below $82,500 might reveal targets around $81,500 and the recent low of $80,308. With momentum and MACD still showing negative trends, the bearish outlook cannot be overlooked, especially as the daily chart continues to illustrate lower highs.