

Bitcoin (BTC) is nearing the $80,000 mark again after a brief retreat from that level. Currently, BTC is trading at $79,031.27, reflecting a 1.9% increase over the last 24 hours.
While this upward movement is encouraging, there are signs of a shift in Bitcoin’s demand dynamics that warrant attention.
Not Everything is as it Seems
Data from CryptoQuant indicates that Bitcoin’s market may be transitioning from a phase dominated by spot trading to one influenced more by futures and leverage.
Historically, such transitions often occur at the beginning stages of a substantial bull market. However, this doesn’t imply that investors are offloading their Bitcoin holdings.
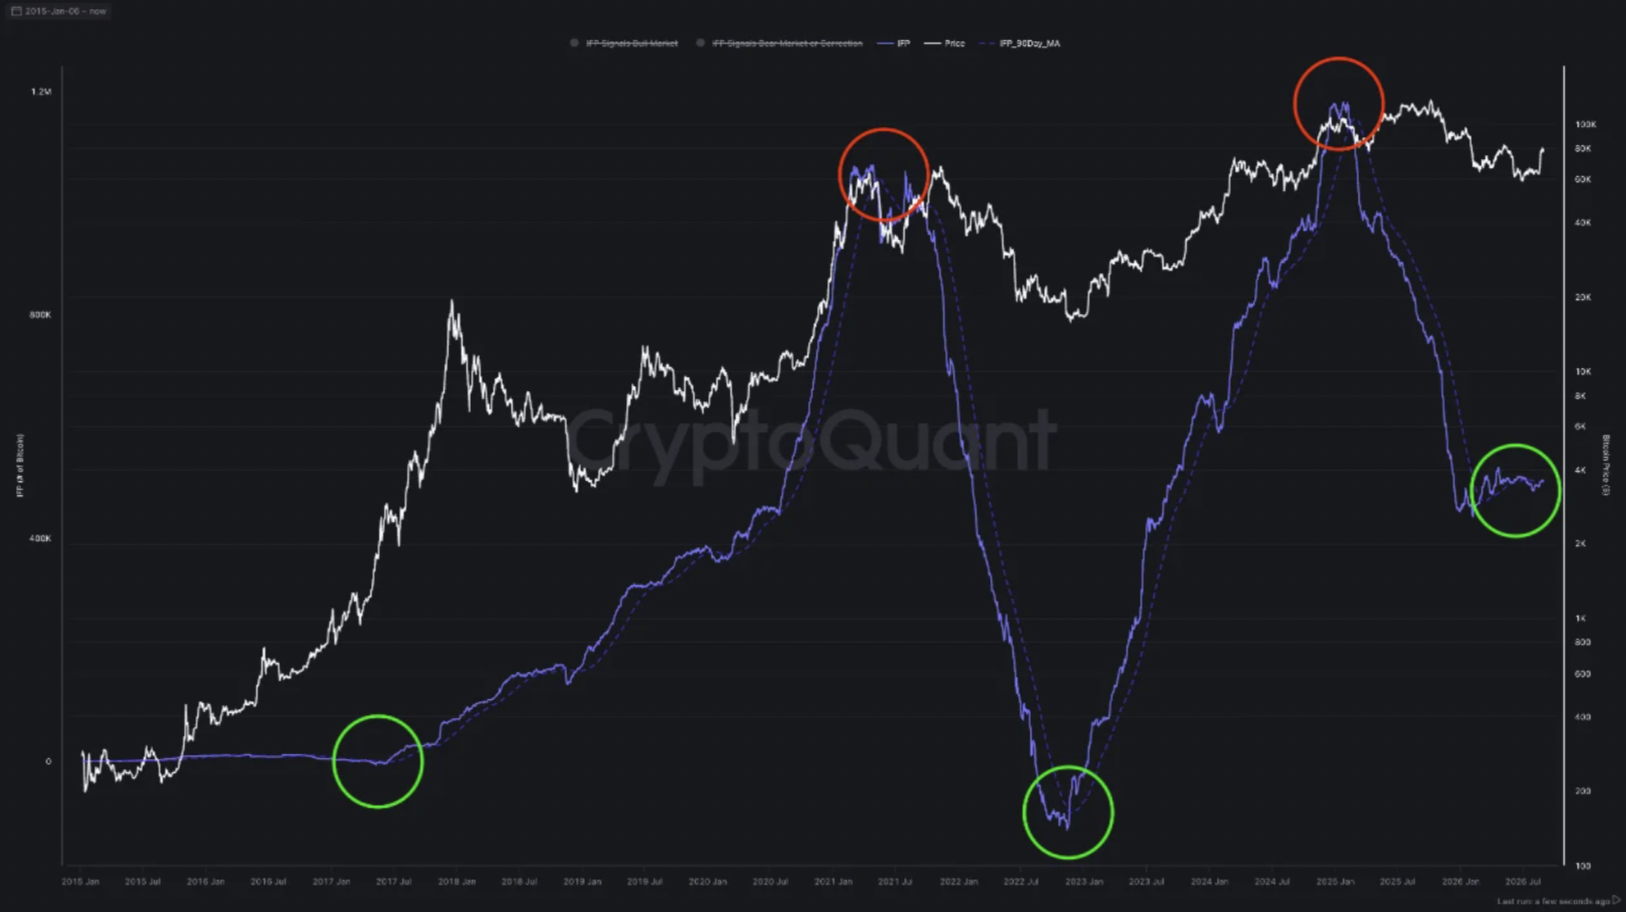
Instead, it appears that investors are preparing to utilize Bitcoin as collateral or engage in leveraged futures trading. If more traders take long positions, leverage could amplify buying pressure, potentially leading to a price surge.
In this context, CryptoQuant aptly described the current phase by stating,
#BTC The dawn of a new cycle is breaking
Underlying Concerns
As September arrives, an atmosphere of unspoken FUD (fear, uncertainty, and doubt) looms over the crypto space.
Many analysts are evaluating whether September 2026 will diverge from historical trends or replicate past negative patterns.
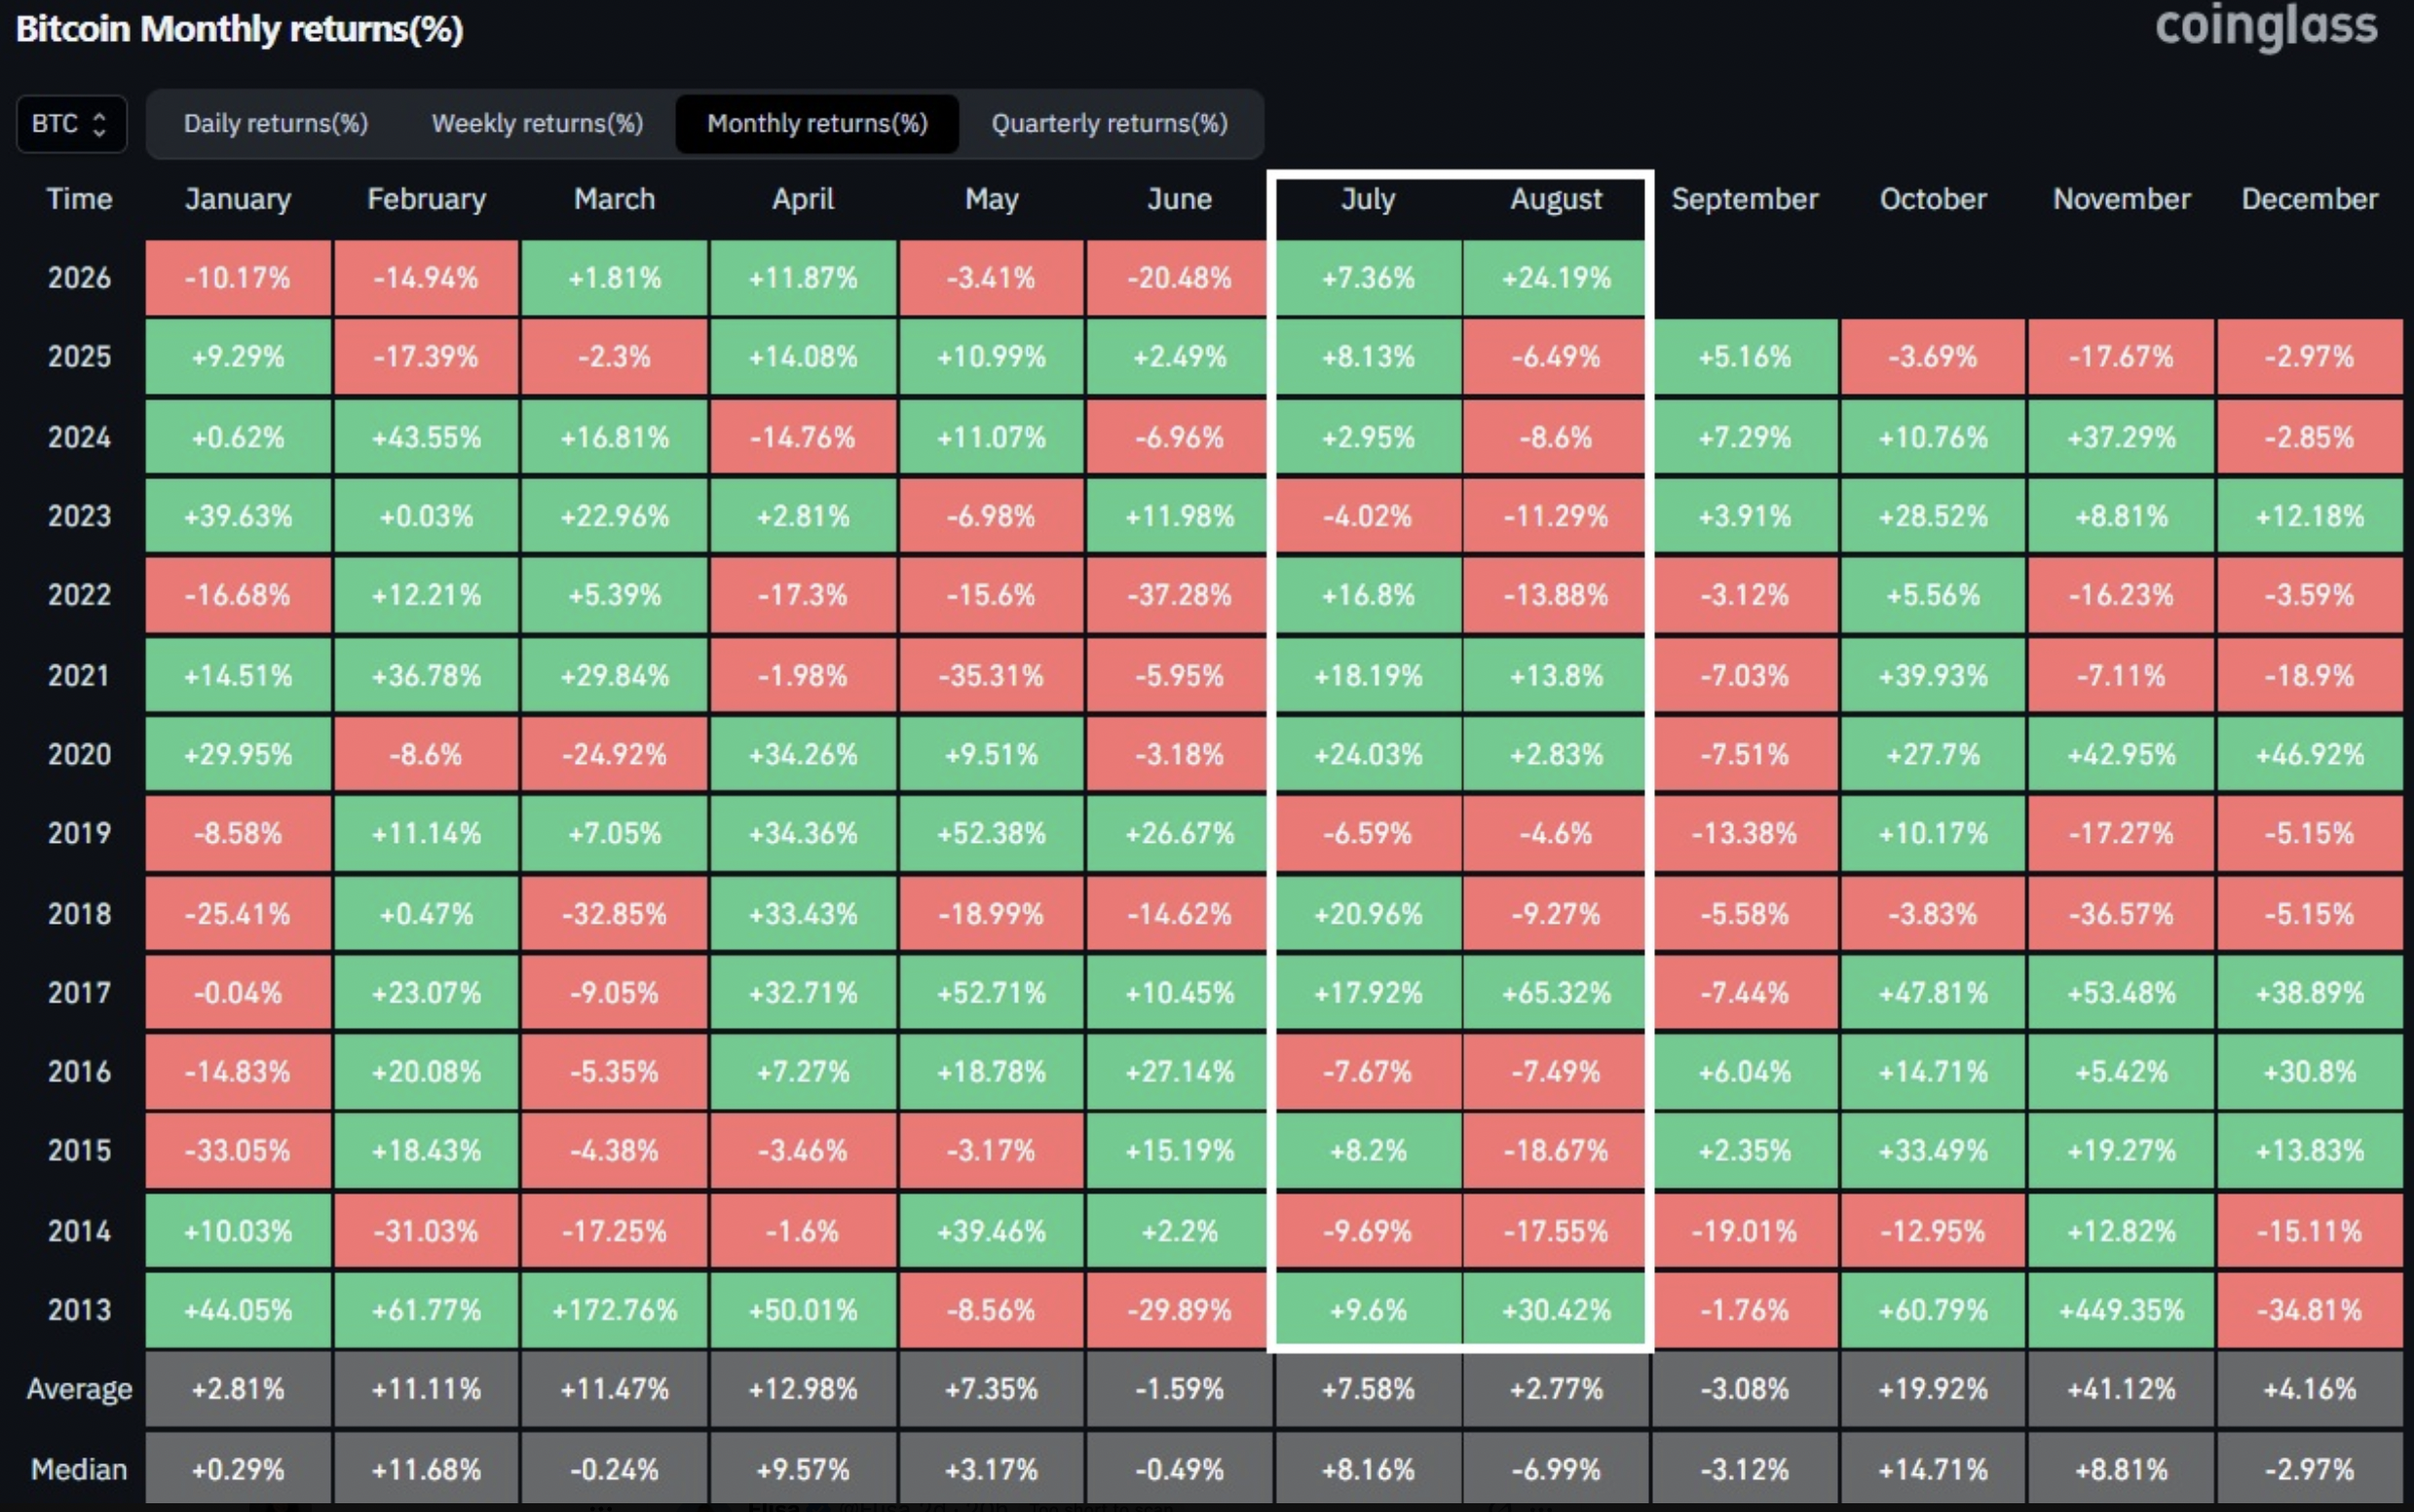
For example, in 2021, July saw an 18.19% increase, followed by a 13.80% rise in August, only for September to decline by 7.03%. A similar trend occurred in 2020, with July’s 24.03% spike and August’s 2.83% gain leading to a 7.51% drop in September.
What Makes September 2026 Unique?
This year is particularly significant since July 2026 appreciated by 7.36%, and August surged by around 24.19%, indicating strong closing months and setting up a promising backdrop.
However, this current trend alone isn’t definitive enough to suggest Bitcoin will necessarily fall this September.
According to AMBCrypto, Bitcoin’s September struggles were particularly notable from 2017 to 2022, with six consecutive months showing negative returns.
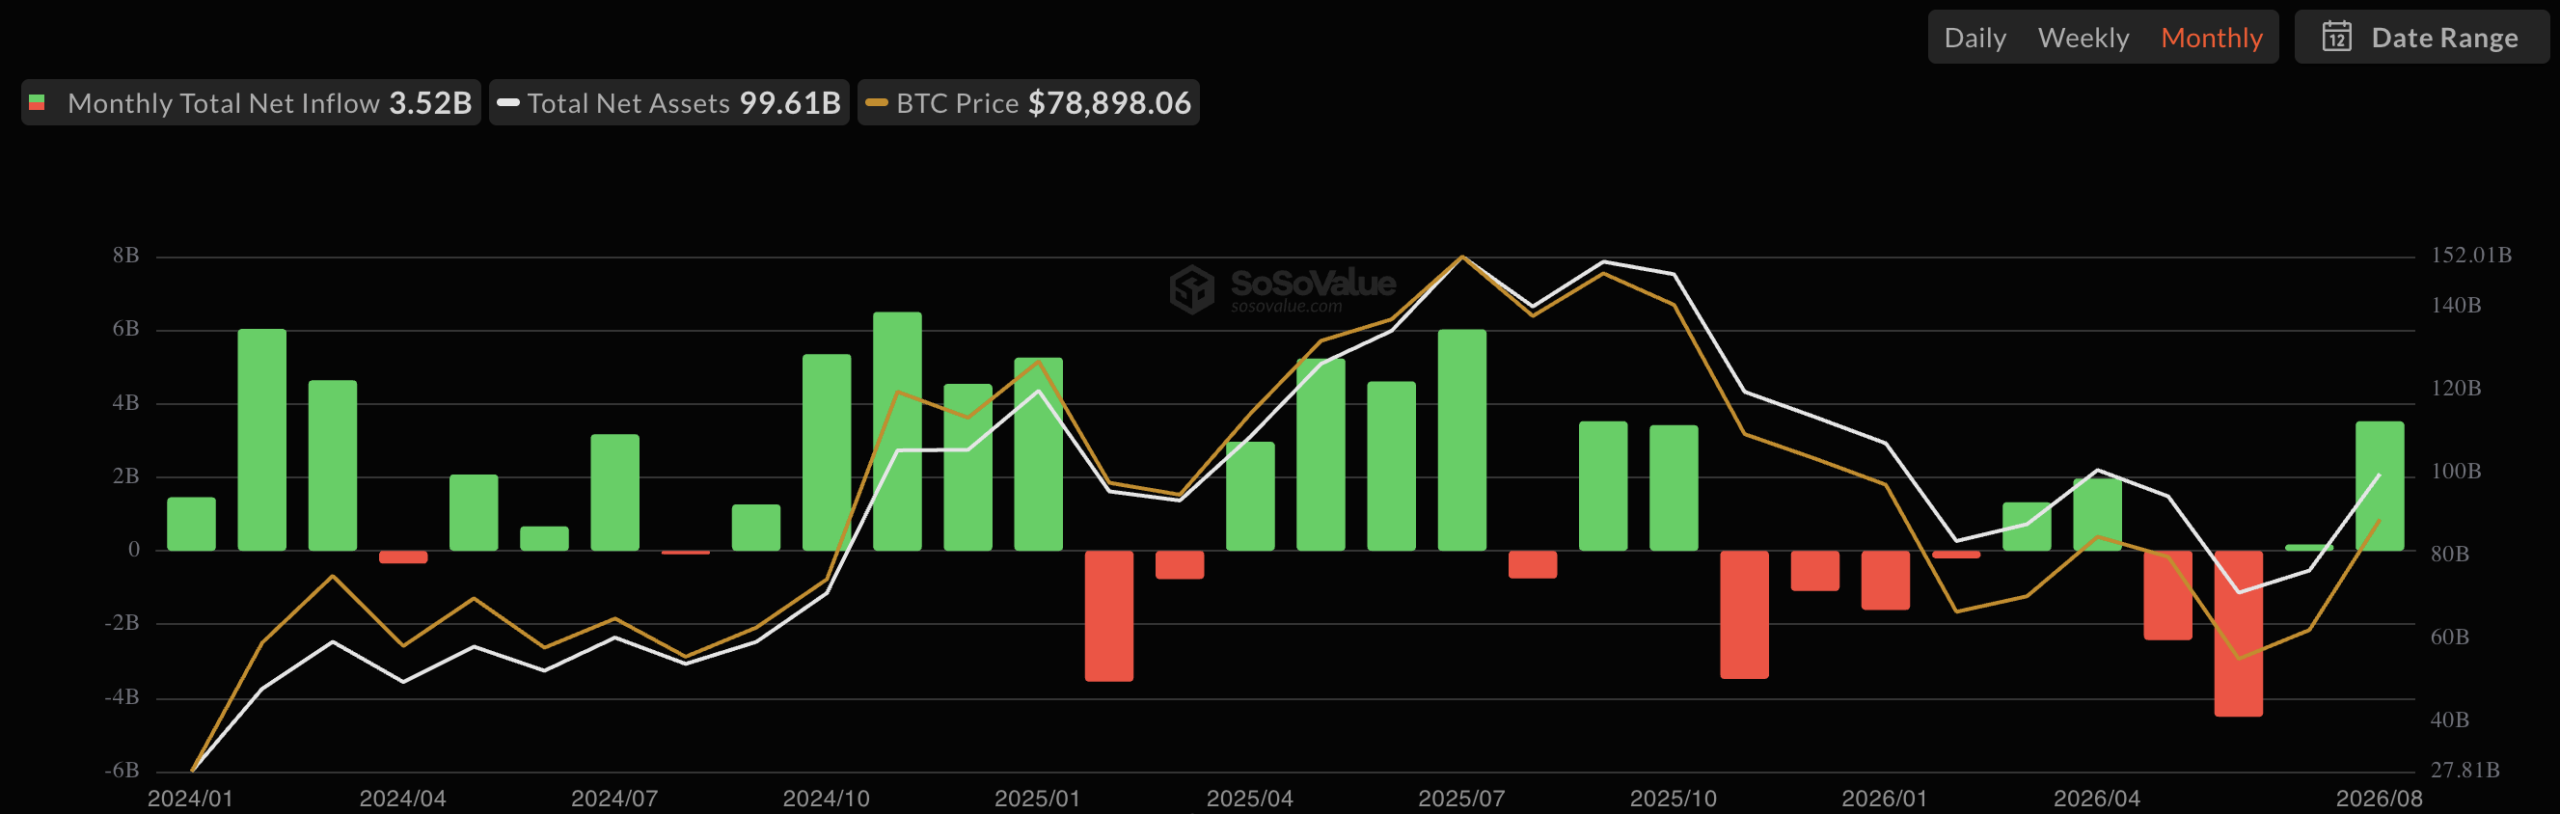
Post-2022, this pattern weakened, and the results for September in 2023, 2024, and 2025 were positive. Notably, Bitcoin ETFs recorded monthly inflows of $172.43 million in July 2026 and $3.52 billion in August 2026, suggesting optimism remains.
Future Outlook
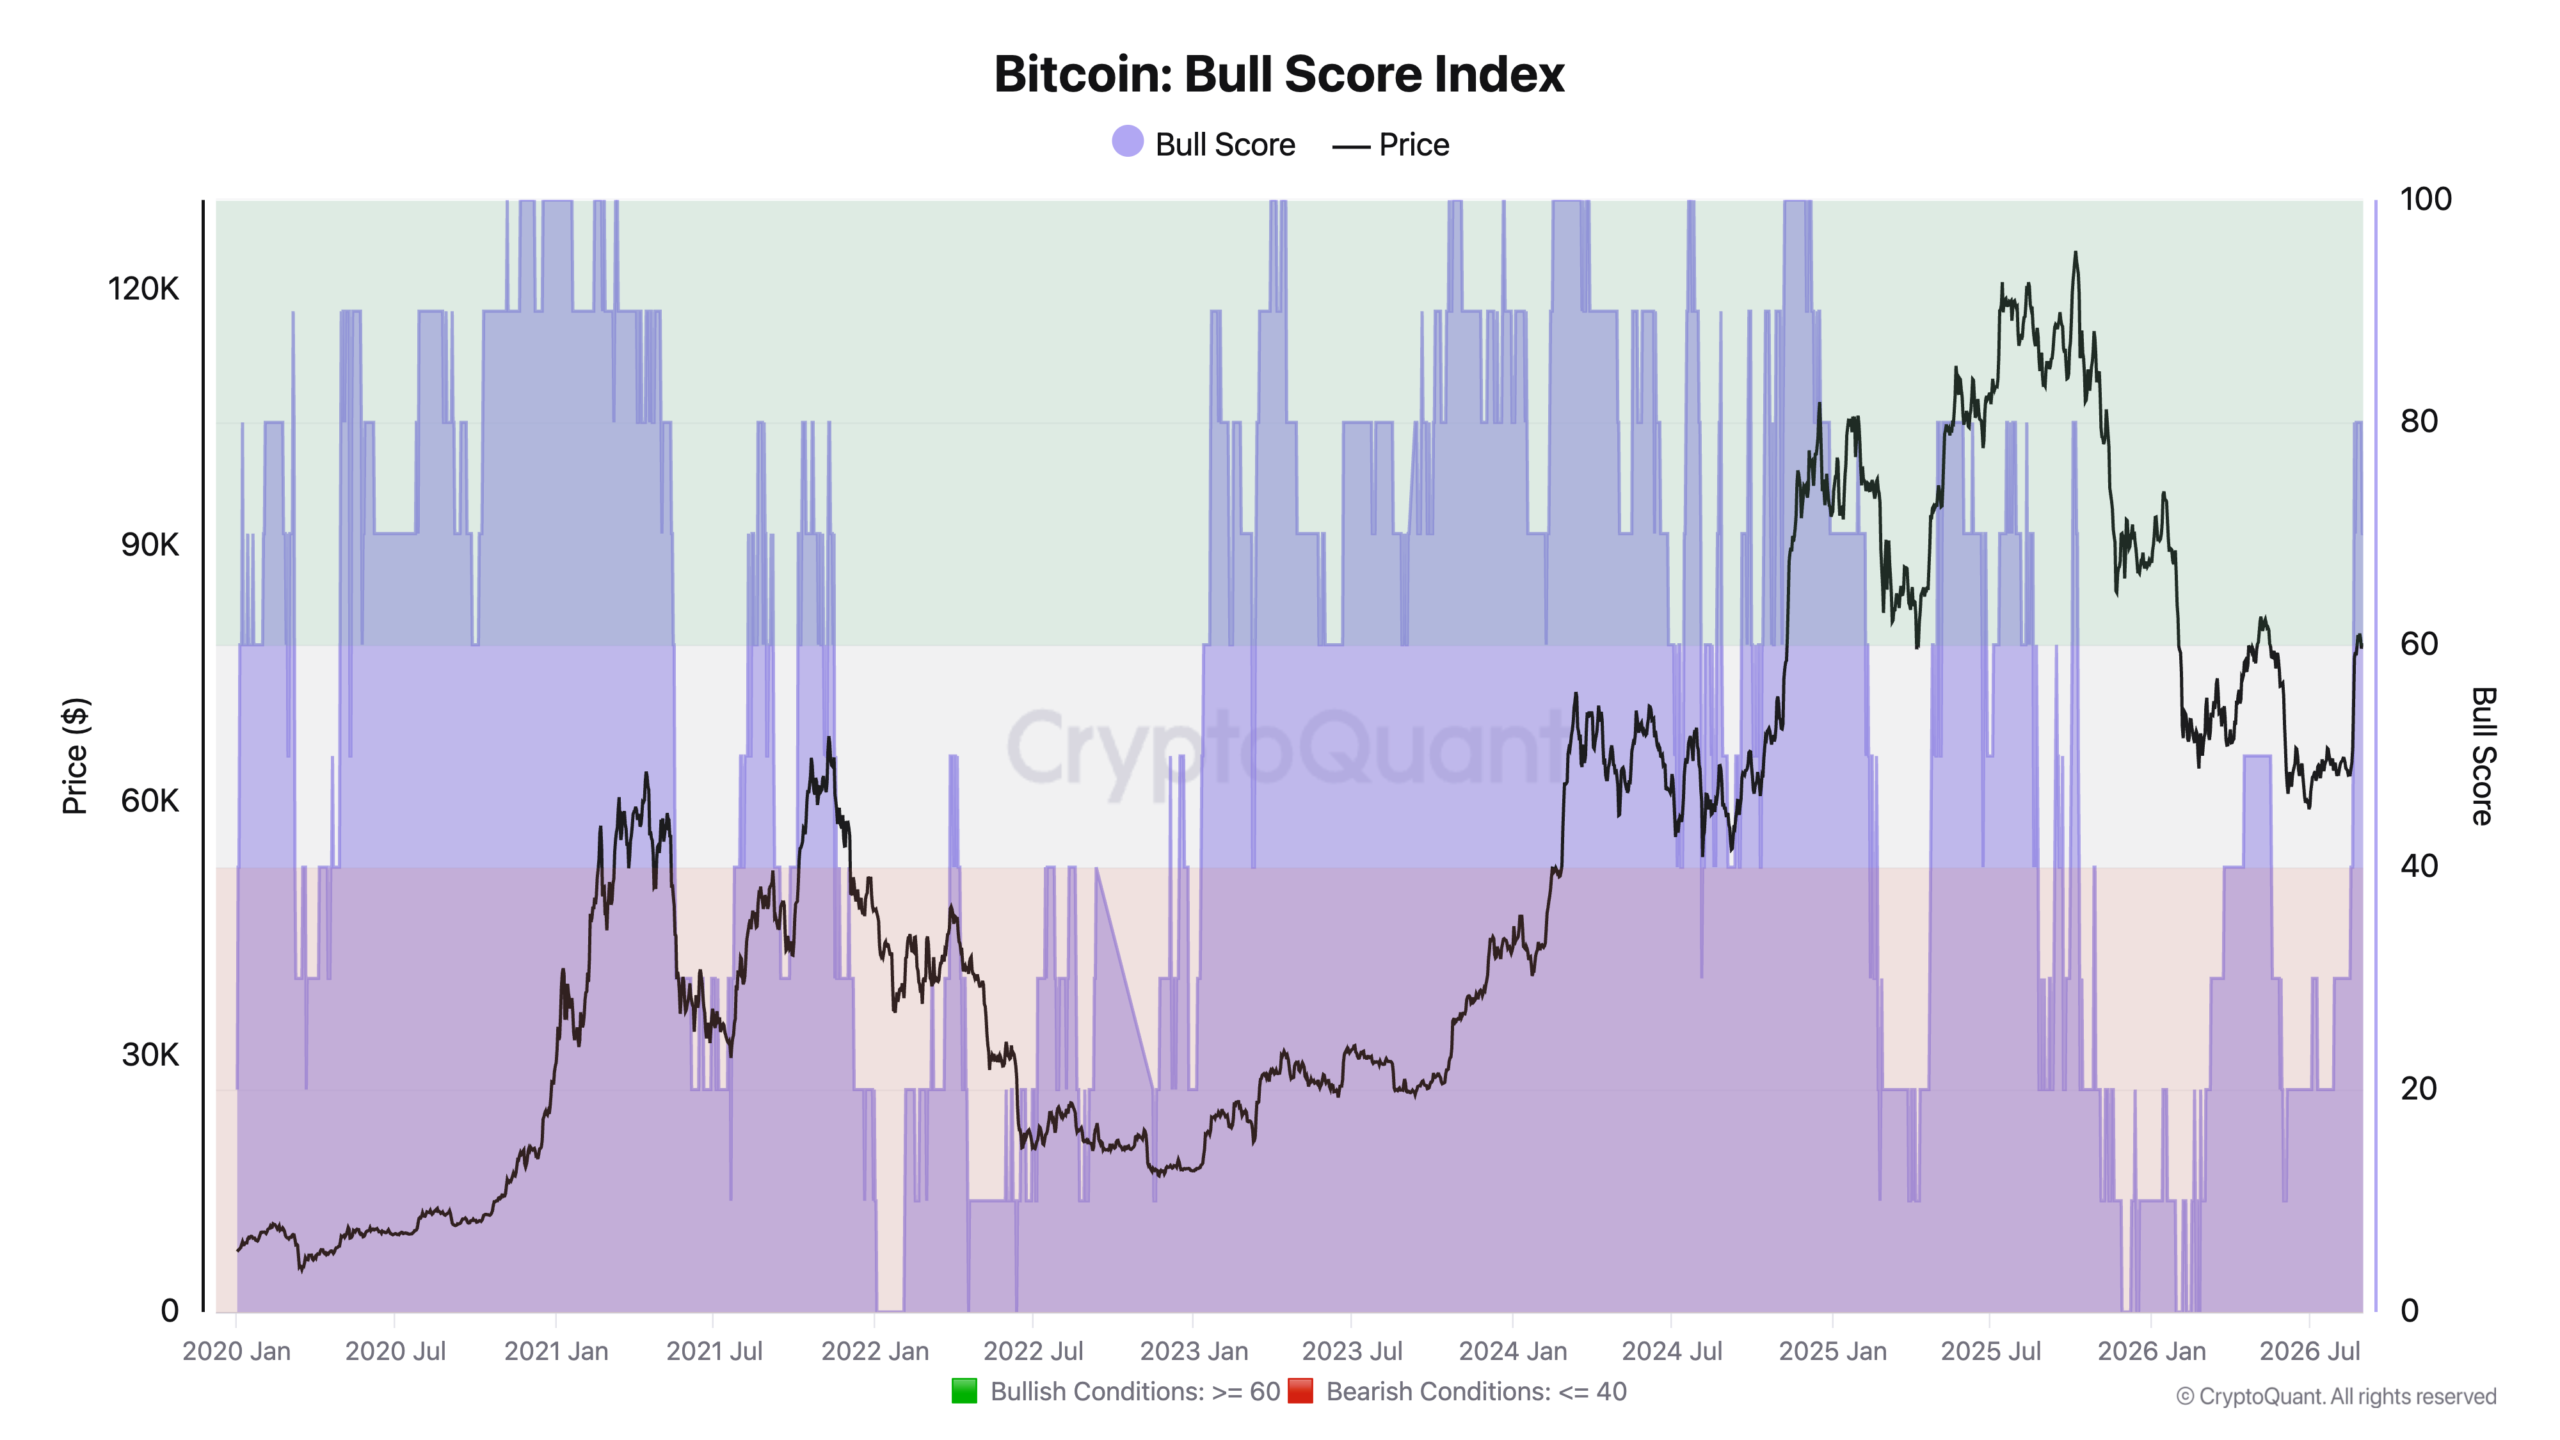
The Bitcoin Bull Score has surged from 30 to 80, marking the most rapid upward shift in a year. This suggests a notable change in market momentum.
Furthermore, the PnL Index crossing above its 365-day moving average is an encouraging development, suggesting an upswing in the profitability of Bitcoin holders and overall market conditions compared to the long-term trend.
This mirrors what was observed during the 2023 market recovery.
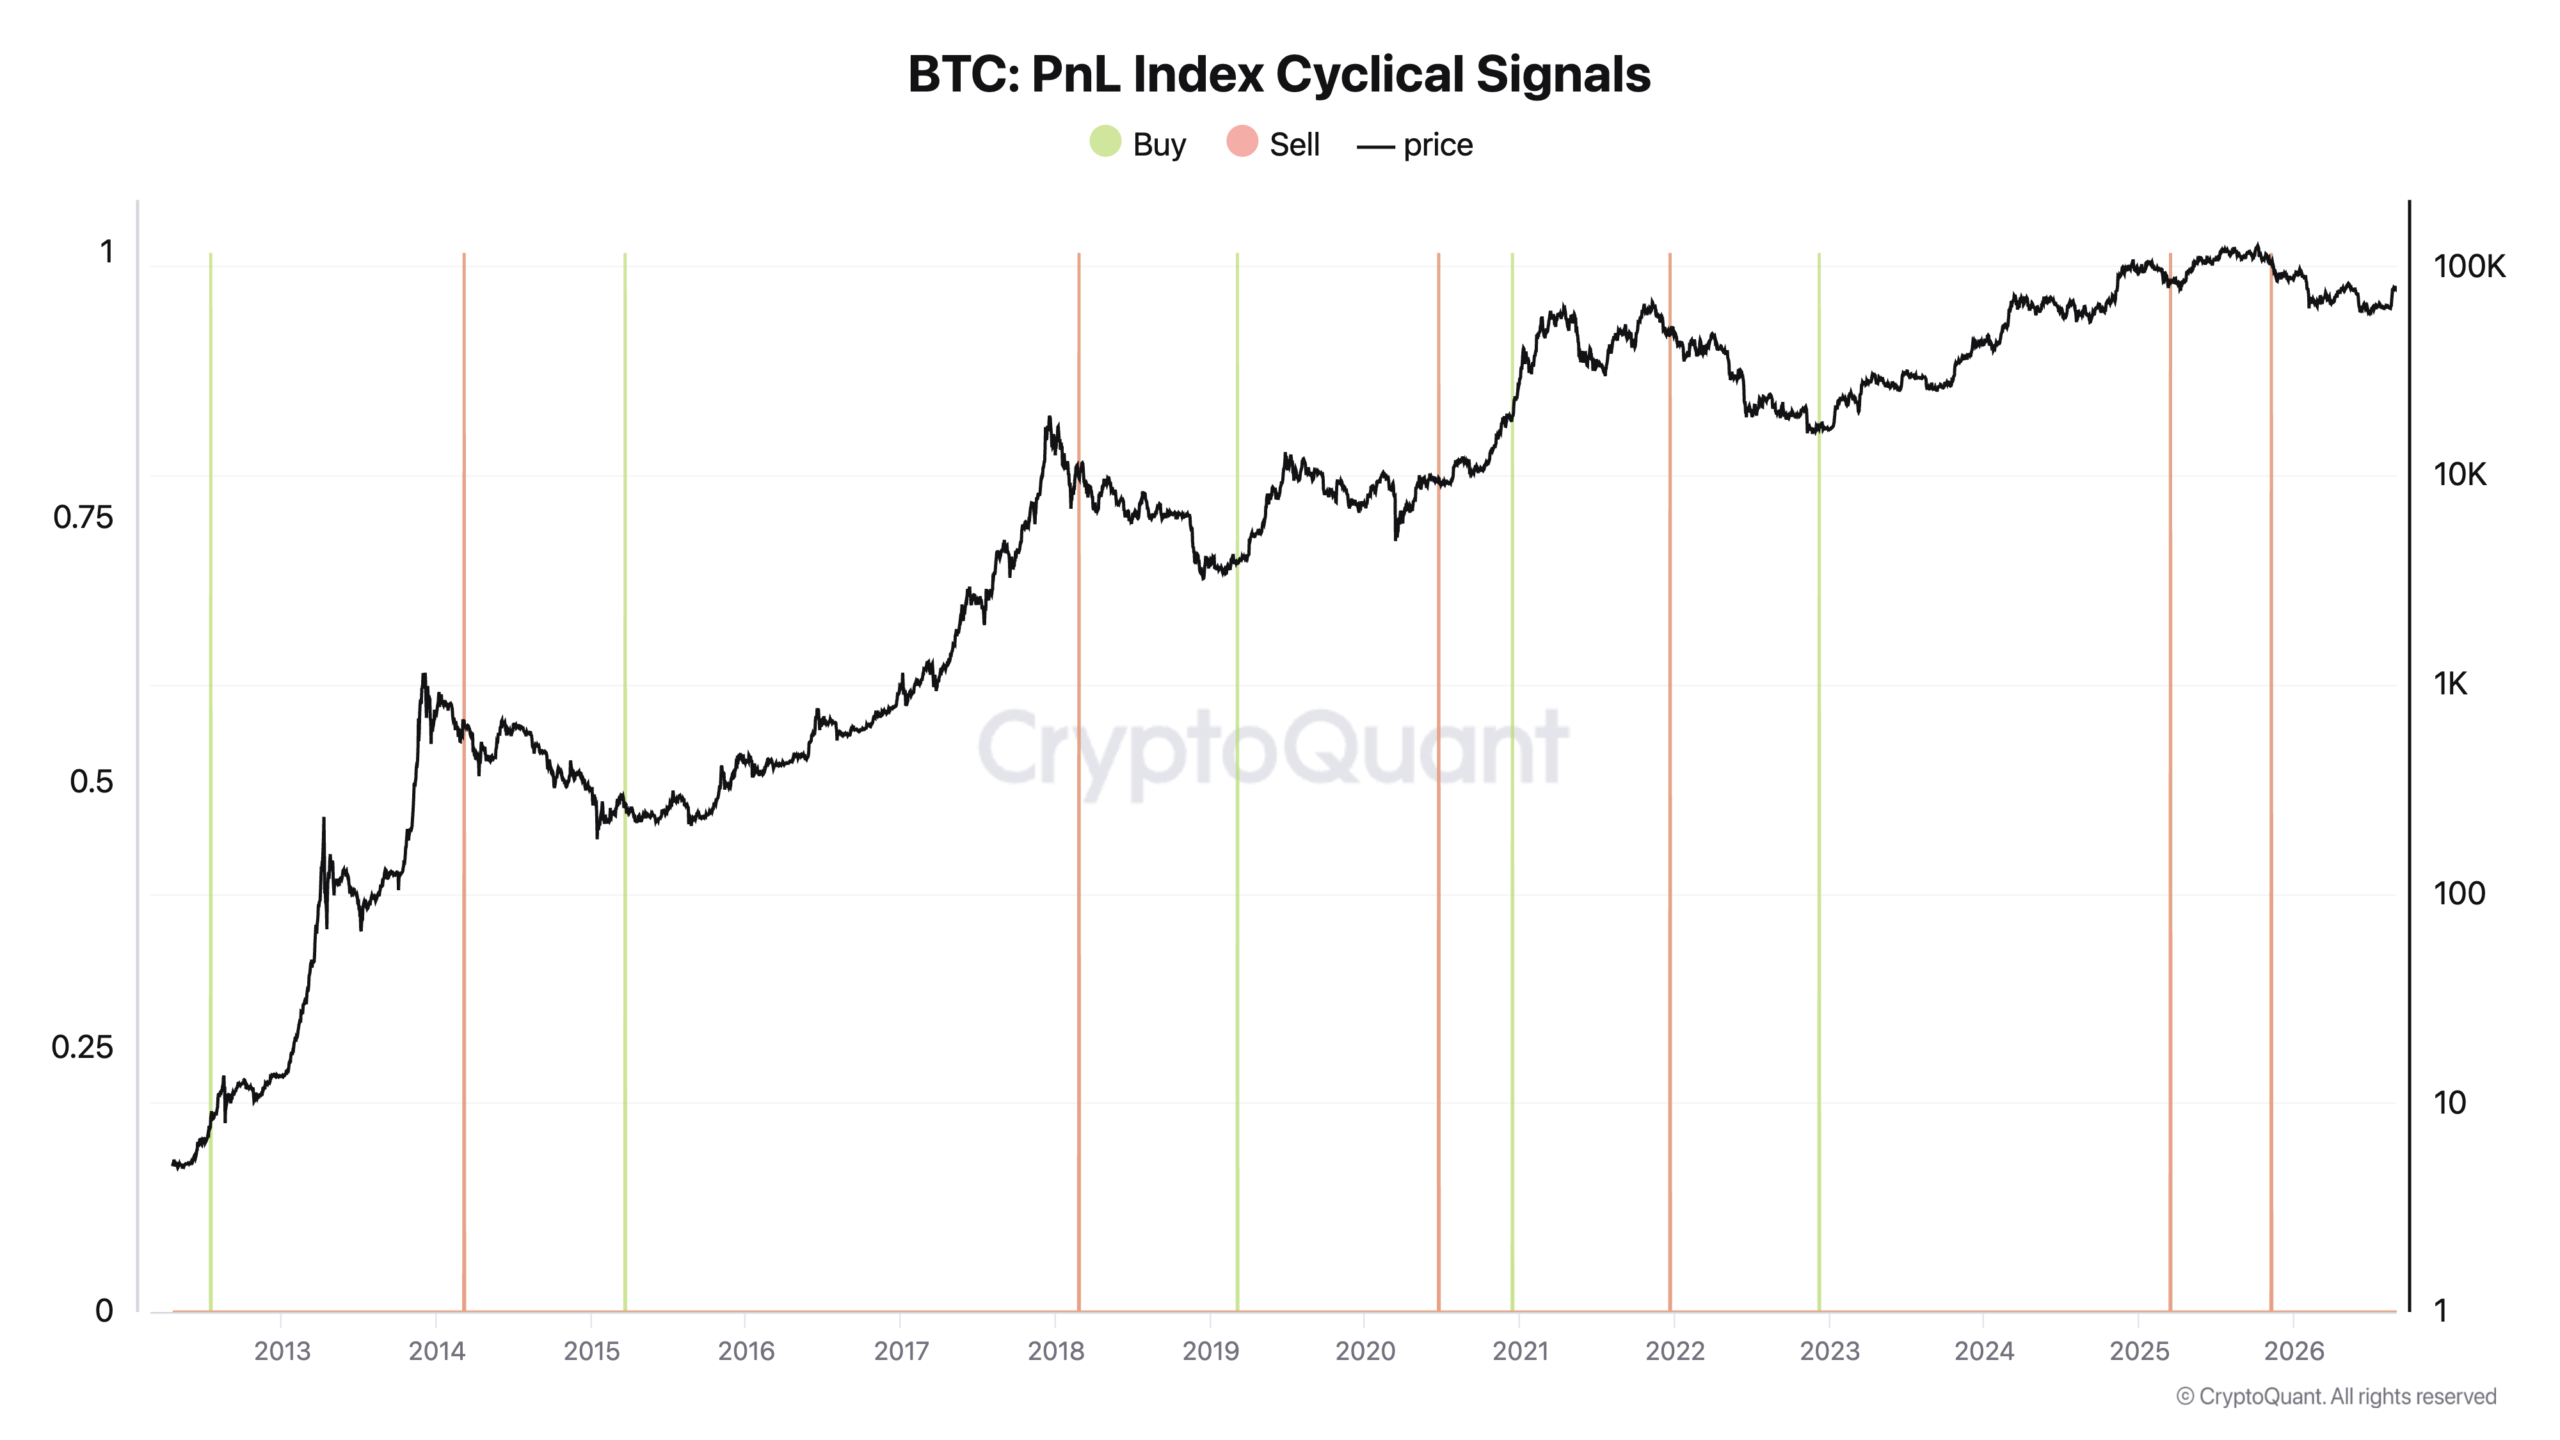
In summary, the market is indicating that the bear cycle could be coming to an end, but a critical threshold remains at $83,000, which would define the onset of a true bullish trend. Should it fail to reclaim this level, it may lead to consolidation or another downside test.
Key Takeaways
- Bitcoin’s market dynamics are evolving from spot trading to futures and leverage trading.
- BTC’s Bull Score has surged from 30 to 80, while prices inch closer to the $80K mark.