

The price of Bitcoin has retreated toward $65,700 after approaching the $67,000 mark, as traders exercise caution ahead of Alphabet’s earnings report and react to a significant surge in oil prices, steering them away from risk-oriented assets.
As reported by crypto.news, Bitcoin ($BTC) was trading around $65,970 at the time of this report, reflecting a decline of roughly 1.5% for the day after hitting an intraday peak of $66,886. This pullback follows a multi-day recovery from a July low near $58,000, with traders hesitant to push the price higher ahead of key quarterly reports from major tech firms.
U.S. stock futures experienced a slight decrease on Wednesday as investors awaited earnings from Alphabet and Tesla. Alphabet is under particular scrutiny as Wall Street seeks clear signs that its significant investment in artificial intelligence will yield sustainable returns. Analysts project the company’s annual capital expenditures will reach between $180 billion and $190 billion, as reported by Reuters.
Concerns about potential cutbacks in AI infrastructure spending have also caused significant fluctuations in semiconductor stocks. This weakness in the chip sector could put pressure on the Nasdaq, subsequently affecting Bitcoin, which has maintained a strong short-term correlation with high-growth stocks during times of market volatility.
In other news, U.S. spot Bitcoin exchange-traded funds recorded net inflows of $203.2 million on July 21, according to Farside Investors. BlackRock’s IBIT led with $163.9 million, while Fidelity’s FBTC contributed $23.1 million. This total represents a decrease from $226.8 million in the previous session, indicating positive institutional demand but insufficient to drive $BTC past the high seen in June.
Bitcoin price needs to surpass $67,000 for a bullish outlook
On Bitcoin’s 4-hour chart, the $66,950 level is identified as the upper limit of the recovery range that initiated from the July 1 low of $57,799. Buyers briefly tested this boundary on Tuesday before profit-taking caused the price to retract below $66,000.
A confirmed daily close above $66,950 would mark Bitcoin’s first daily higher high since the rally in May, potentially establishing $67,000 as a support level. Trader Daan Crypto Trades stated that a breakout above the June high would initiate “a daily bullish market structure break,” paving the way for further upward movement.
$BTC is nearing the June high of $67,000.
An upward breach would create a daily bullish market structure break, establishing a higher high.
This would mark the first daily higher high since May’s surge pic.twitter.com/v9asbjcYOw
— Daan Crypto Trades (@DaanCrypto) July 22, 2026
The daily chart also reveals positive signals; $BTC remains above its 20-day and 50-day simple moving averages at $64,065 and $63,135, respectively. These averages now serve as the first area of dynamic support, while the Chaikin Money Flow reading of 0.13 indicates that capital inflows have exceeded outflows during the recent recovery.
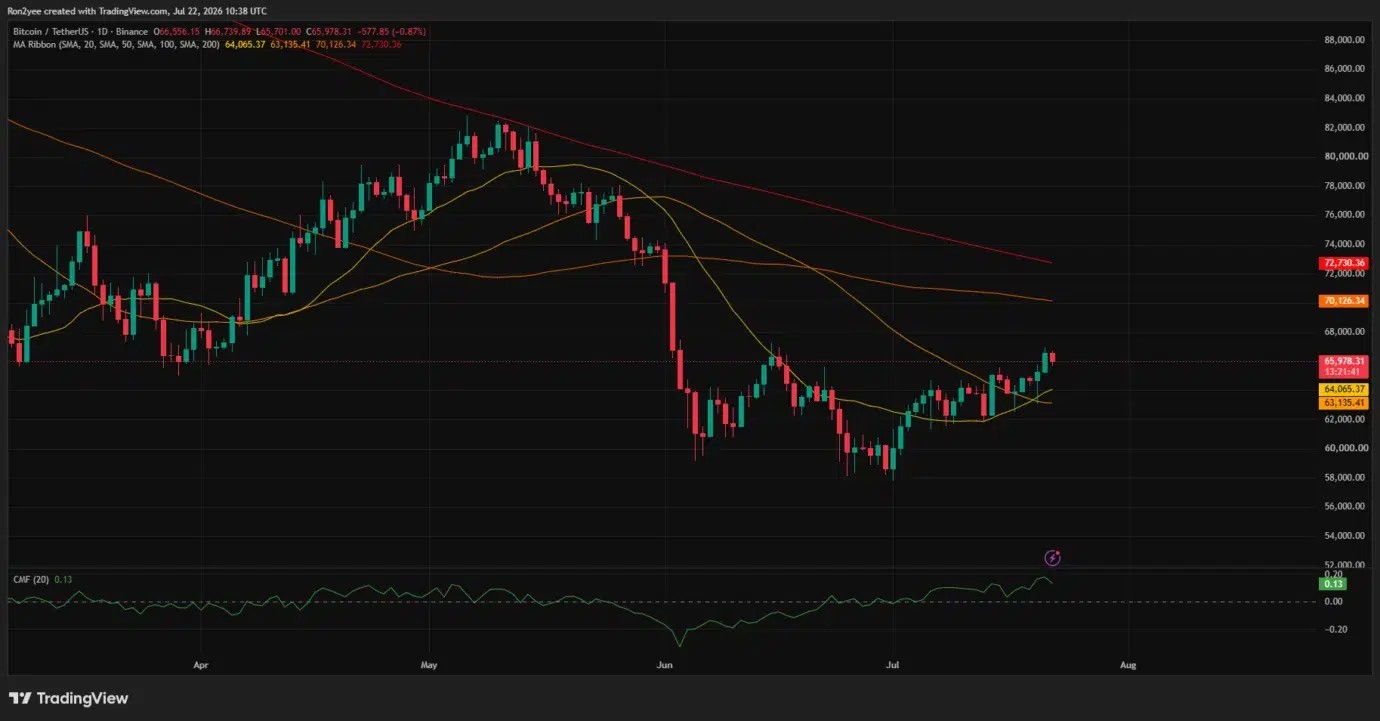
Long-term resistance is positioned significantly higher. Bitcoin is trading below the 100-day SMA at $70,126 and the 200-day SMA at $72,730, indicating the daily trend has yet to fully reverse. A sustained move above these averages would reveal the $76,000 level and diminish the impact of the decline from May’s peak near $82,000.
Analyst Ted Pillows has observed that Bitcoin’s daily Supertrend indicator has shifted from bearish to bullish. In comparison to the previous signal, Pillows commented:
“The last trigger led to a nearly 15% rise in Bitcoin over 4 weeks. A similar pump could push $BTC to $76,000 by August.”
While momentum remains positive, it has diminished somewhat post-rejection. The 4-hour relative strength index has fallen to 58.09 from above 60, keeping $BTC away from overbought territory. The MACD is above its signal line, though the diminishing positive histogram indicates that buyers have slowed their accumulation rate.
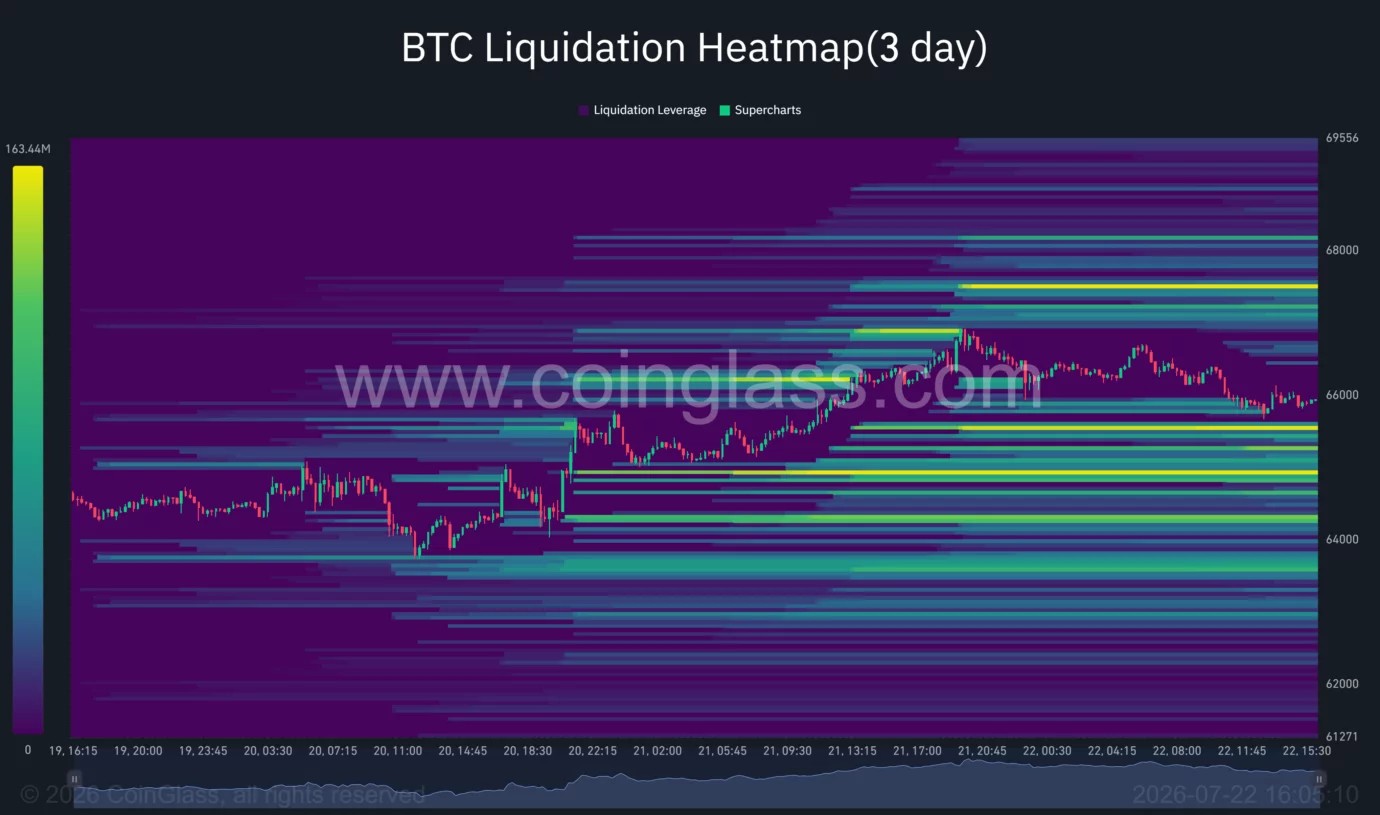
CoinGlass’ three-day liquidation heatmap shows the largest nearby short-liquidation pool around $67,300, with another dense band near $68,000. A move past $66,950 could compel leveraged sellers to close their positions, providing the momentum needed to test both zones. Conversely, long-liquidation clusters are located around $65,500, $64,700, and $64,300.
Oil prices and Federal Reserve factors pose threats to recovery
West Texas Intermediate (WTI) crude rose over 4% to $87.99 on Wednesday, while Brent surpassed $94, driven by heightened tensions between the U.S. and Iran which raised concerns about supply routes. President Donald Trump has dismissed immediate negotiations with Tehran and has signaled potential further action against the suspected nuclear facility at Pickaxe Mountain. Houthi threats to shipping have added further risks in the Red Sea and Bab el-Mandeb Strait.
Rising energy prices could extend inflationary pressures and limit the Federal Reserve’s capacity to support markets. A July survey indicated that economists expect the Fed to maintain its policy rate of 3.50%–3.75% through 2026, although more respondents now foresee a significant chance of an increase. High oil prices and elevated Treasury yields would heighten the challenges for speculative assets like Bitcoin.
A close below the 78.6% Fibonacci level at $64,992 on a 4-hour basis could undermine the current recovery, exposing the price to $63,455 followed by $62,375. Losing the daily moving-average cluster near $63,100 would invalidate the short-term bullish setup and potentially push $BTC back to $61,295.
For the positive outlook to hold, Bitcoin needs to maintain support at $65,000 and close robustly above $66,950. Until then, factors such as oil prices, Alphabet’s earnings report, and leveraged positions could leave $BTC exposed to a potential liquidity sweep below the current price range.