

The price of BNB surged by over 5% before traders halted progress around the $600 mark, settling at approximately $590 on July 31 as investors evaluated the sustainability of this breakout.
Overview
- BNB’s price rose above $590 after crossing a downward sloping trendline that had restricted it for nearly 45 days.
- The daily price crossed the Bollinger Band’s upper limit of $587.85, indicating strong but potentially overextended momentum.
- A three-day liquidation heatmap highlights major liquidity zones around $580 and $605–$610.
- The 4-hour RSI remains at a bullish 65.14, while the MACD continues to suggest bullish momentum.
Current BNB Price Movement
Data from crypto.news indicates that BNB (BNB) has jumped from around $570, reaching an intraday peak close to $595, before settling around $590 as per the latest charts. This movement has pushed the token beyond the narrow trading range established during the latter half of July.
The 4-hour chart illustrates a significant breakout above $575, leading to an extension towards $595. Buyers have since defended the range between $586 and $590, but multiple upper wicks near $595 indicate ongoing selling pressure below the crucial $600 threshold.
BNB has tested this broader resistance area multiple times since June, hitting nearly $598 on June 22 and approaching $594 in early July, but failed to maintain movements above $600.
The latest breakout appears more robust than prior attempts due to a series of higher lows around the $560–$570 range. Nonetheless, the token must close above $600 to confirm that the broader consolidation phase has concluded.
Factors Influencing BNB’s Recent Movement
The primary driver of this movement seems to be technical positioning. BNB successfully broke above a downward resistance line that has connected lower highs since mid-June when the token traded around $632.
Analyst Hanah noted this moment as a potential shift in short-term momentum following a 45-day downtrend.
“If BNB maintains above this breakout point, it could set the stage for a more sustained bullish advance.”
Network activity has also contributed positively to the recovery. Reports indicate that BNB Chain processed about $19 billion in weekly decentralized exchange volume, outpacing both Ethereum and Solana during this period. Network activity has risen from around 17% to nearly 30%.
SilentSwap’s integration introduced an additional use case by facilitating private cross-chain swaps within the ecosystem. The increase in transactions and gas utilization may bolster demand for BNB, which is necessary for fee payments across the BNB Chain.
However, these developments do not assure that BNB will surpass $600. The immediate increase is still predominantly influenced by technical factors and liquidity surrounding nearby resistance levels.
Indicators Favor Buyers Yet Show Overextension
BNB concluded near $590.15 on the daily chart, above the Bollinger Band’s upper boundary of $587.85. The middle band sits at $573.53, while the lower band is at approximately $559.21.
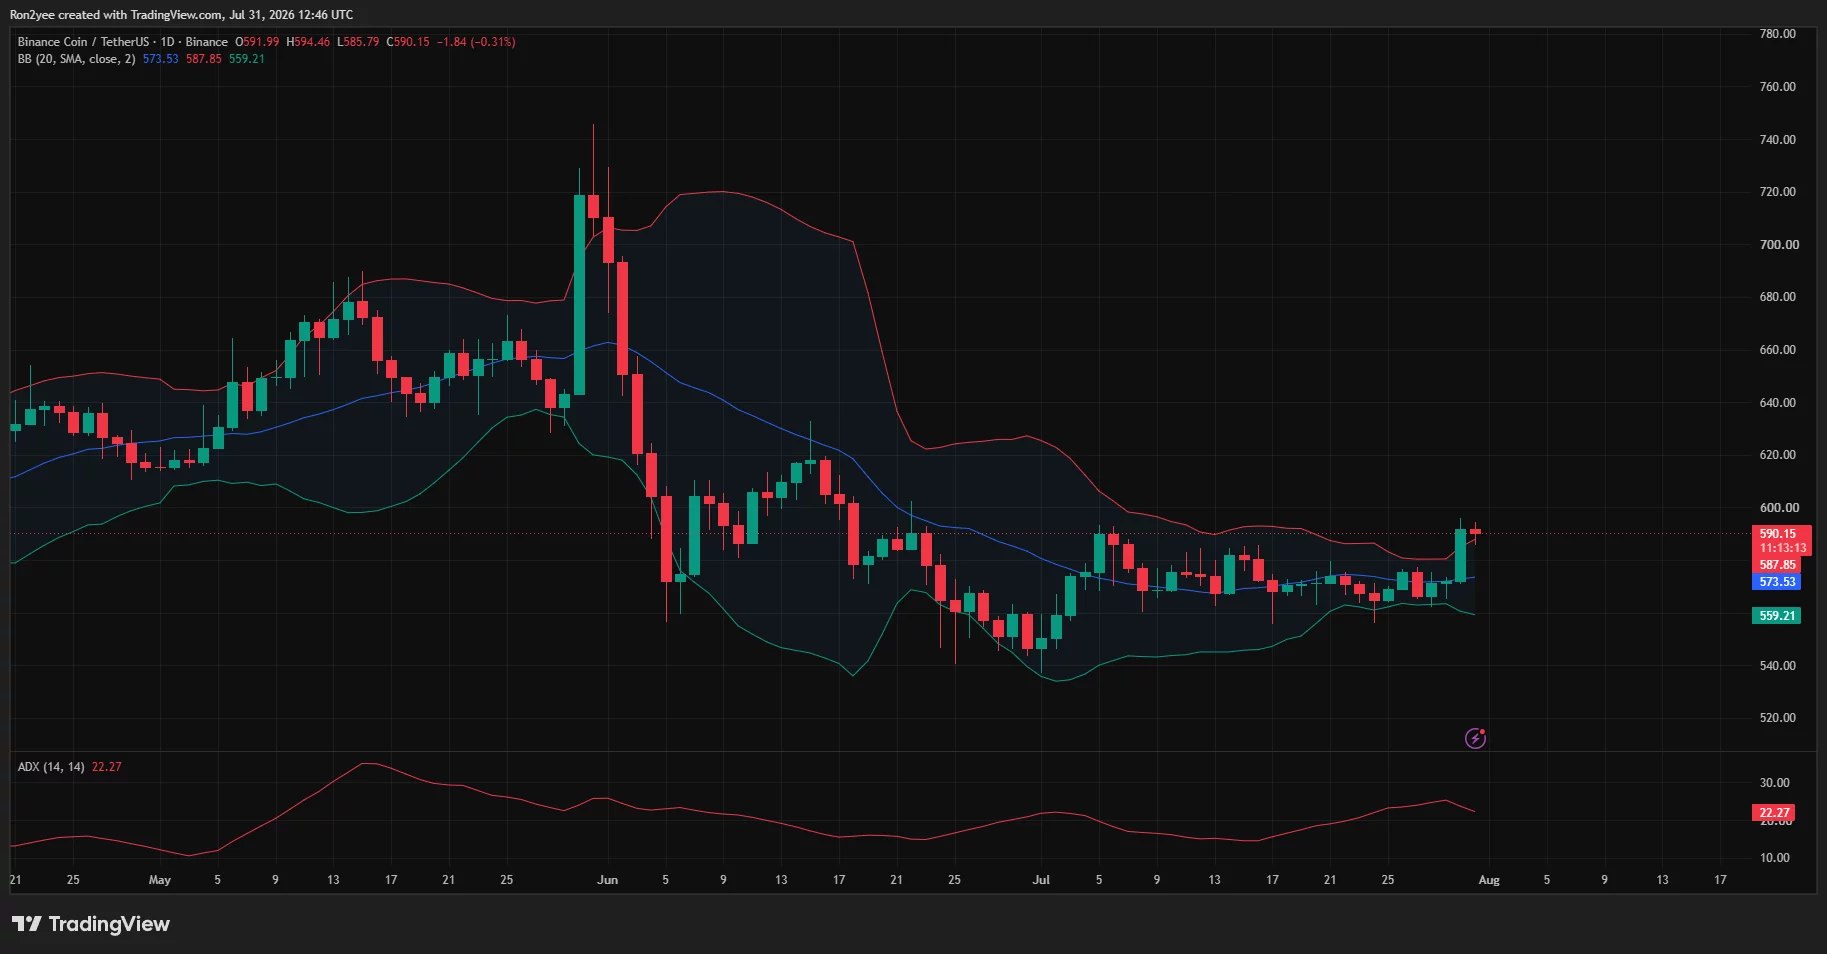
A breach above the upper Bollinger Band indicates robust buying interest, but it can also precede a minor pullback if the price climbs too rapidly. Should daily candles close back within the bands, $573.53 would become the primary mean-reversion target.
The Average Directional Index (ADX) currently reads at 22.27, suggesting the developing trend possesses moderate strength but has yet to reach levels typically associated with stronger directional momentum.
On the 4-hour chart, momentum indicators offer clearer insights. The relative strength index (RSI) is positioned at 65.14, above its 61.84 moving average but short of the overbought threshold of 70. This suggests potential for further advance while also indicating that buyers are nearing overextended conditions.
The MACD line stands at 5.79, above the 4.33 signal line, with a positive histogram reading of 1.46. While this positioning remains bullish, the decreasing histogram bars suggest that the initial momentum may be tapering off.
Crucial BNB Levels to Monitor
The three-day liquidation heatmap pinpoints a substantial cluster of leveraged positions around $605–$610. If BNB can successfully breach $600, this zone could attract price, but it may also heighten volatility as short liquidations and profit-taking occur in this vicinity.
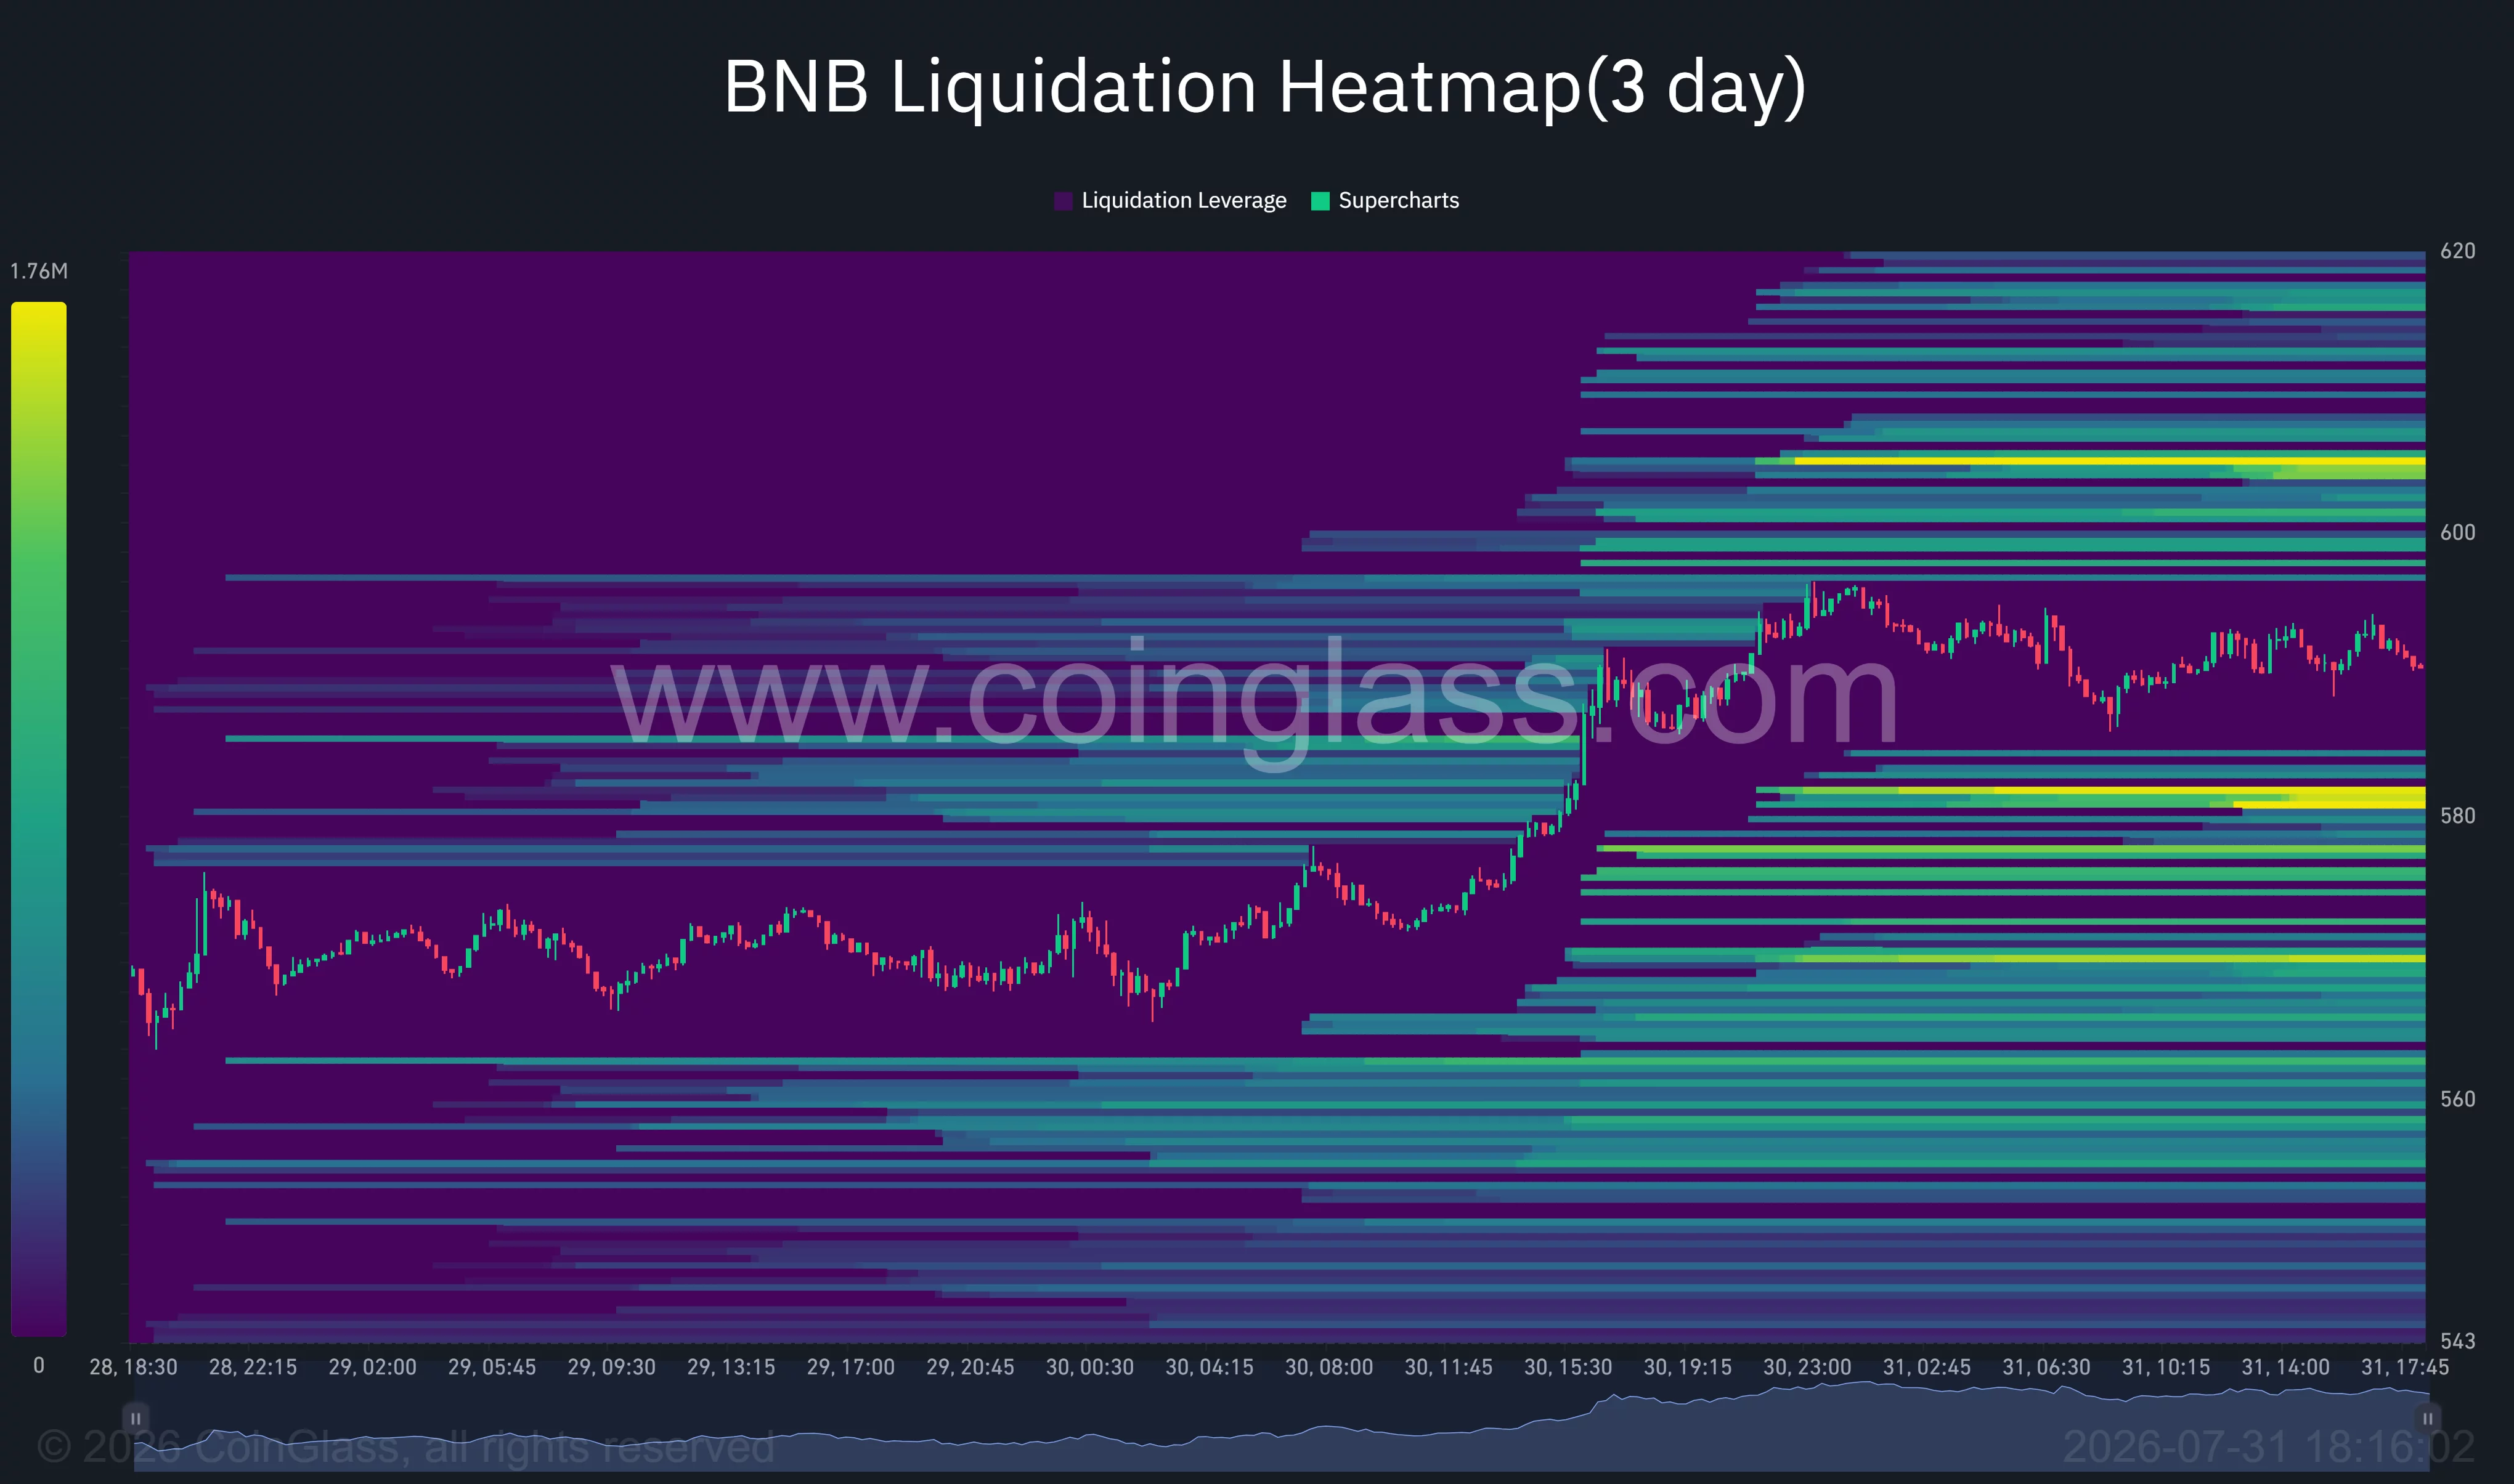
A firm close beyond $610 could fortify the breakout and pave the way towards the previous $620–$632 supply zone, marking the peak that initiated the descending trendline.
Immediate support is found between $587 and $580. The heatmap indicates strong liquidity concentration around $580–$582, which may serve as a potential downside target should the upward trend falter.
If BNB falls below $580, the Bollinger midline around $573.53 becomes the next focal point of technical support. A drop beneath this level could weaken the breakout narrative, exposing prices towards $559–$560, which aligns with July’s established demand region.
Influences on US Market Context Could Hinder Breakout
US investors are closely monitoring the general risk appetite as global tensions and rising energy prices heighten inflation worries. Increased oil prices can complicate the Federal Reserve’s monetary policy outlook, increasing the risk that inflation remains above targeted limits.
A tighter interest-rate environment typically reduces the liquidity available for speculative assets, including altcoins. Consequently, BNB may face challenges sustaining an independent rally if Bitcoin and US tech stocks decline as investors become more risk-averse.
The near-term outlook remains promising as long as BNB stays above $580. A confirmed breakout past $600–$610 would support further gains, while a retreat below $573 would signal that the recent surge was merely another unsuccessful attempt to break out within the established range.
Disclosure: This article serves no investment advice purposes. The content and information provided here are intended for educational use only.