
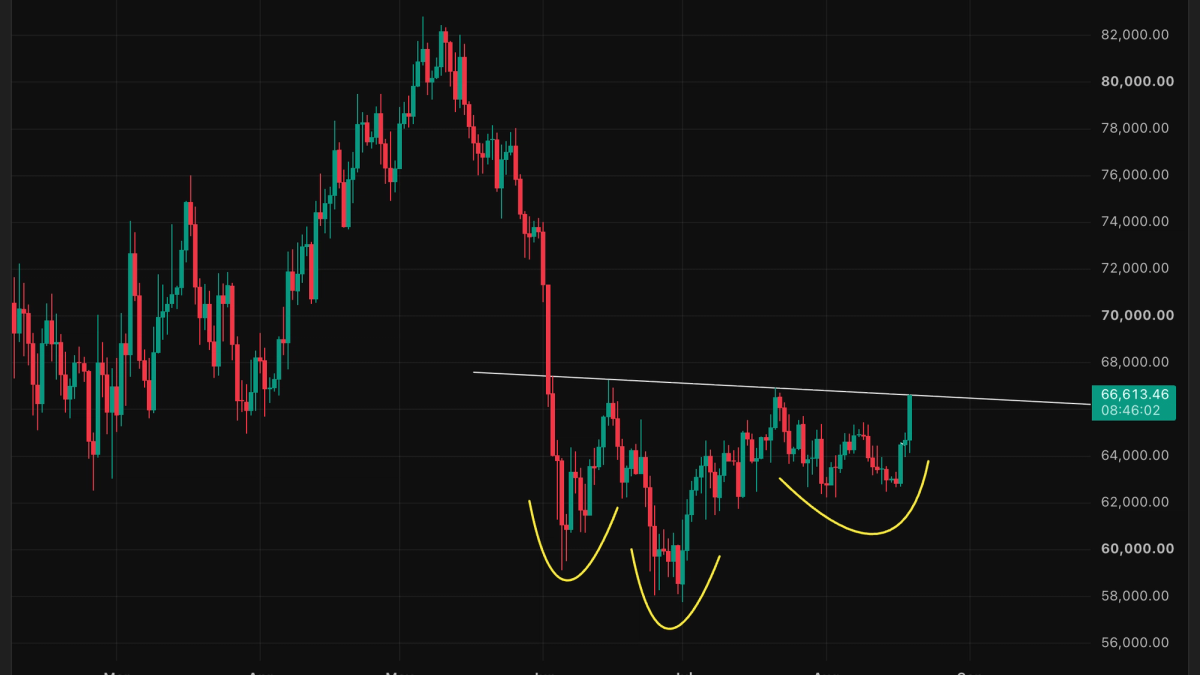
Bitcoin has seen a notable increase of 3% since midnight UTC, propelling it towards a crucial threshold that technical analysts believe could initiate a traditional bullish reversal pattern, paving the way for a significant upward movement.
Technical charts presented by Aksel Kibar from Tech Charts illustrate the emergence of an inverse head-and-shoulders configuration on the daily chart following the lows observed in June.
This pattern, as CoinDesk noted earlier, features three troughs, with the deepest being the middle one, interspersed with short recoveries. The line connecting the recoveries is referred to as the neckline of this inverse pattern.
The neckline resistance for this setup is located around $66,600. Currently, BTC is trading slightly below this mark, with recent transactions happening around $66,500.
A definitive move above the neckline would validate the inverse head-and-shoulders pattern and set a target of $76,000 based on Kibar’s analysis. This target reflects the expected upward movement calculated from the distance between the head and the neckline.
This configuration has been forming since early June, suggesting a possible bottom for the intense bear market that followed a price peak of $126,000 in October of last year.
Traders are keenly observing whether this pattern will confirm a new upward trend.