

Overall, it appears that the markets are facing significant resistance levels.
Upon closer inspection, many top-tier cryptocurrencies have encountered difficulties this week, with Ethereum facing resistance near $1,900. Bitcoin is also meeting resistance around the $65,000 mark, and its market share has dipped below 60%. Meanwhile, $ETH dominance remains under 11%.
This highlights Ethereum’s position, especially since its growth in Q3 has surpassed Bitcoin’s by over twice the amount. Consequently, the $ETH/$BTC ratio has become increasingly significant to monitor in the latter half of August, particularly after this weekend, as it could greatly affect capital movements.
The technical indicators reinforce this observation.
The chart above illustrates that the $ETH/$BTC ratio has faced resistance at the 0.03 point, struggling to break through this barrier since the start of the first quarter. The ratio has attempted to exceed this resistance level on two occasions but has not succeeded.
With the market as a whole showing signs of resistance, the upcoming week is critical for Ethereum. A third rejection could further reinforce resistance for the ratio, but if Ethereum manages to overcome this hurdle, it may entice investors to redirect their funds into $ETH. Additionally, key on-chain indicators suggest that the market is gearing up for movement, with a particular emphasis on Ethereum.
Ethereum encounters a crucial challenge as on-chain indicators gain traction
Ethereum [$ETH] appears poised for a potential upward movement as signs of seller fatigue, positive technical indicators, and institutional interest converge.
CryptoQuant reports that the selling pressure on $ETH is at its lowest point, even compared to the levels seen during the 2022 bear market. This indicates that a potential bottom may be forming, although there could still be one final drop before $ETH establishes a firm base.
Nonetheless, institutional positioning suggests that investors are not factoring in another major downturn. Bitcoin ETFs recorded inflows of $389.7 million exiting last week, whereas Ethereum ETFs saw $6.7 million in inflows, as depicted in the chart below. Traditional finance is selling Bitcoin while quietly investing in Ethereum. Such divergence tends to appear in the $ETH/$BTC ratio before being reflected in price changes.
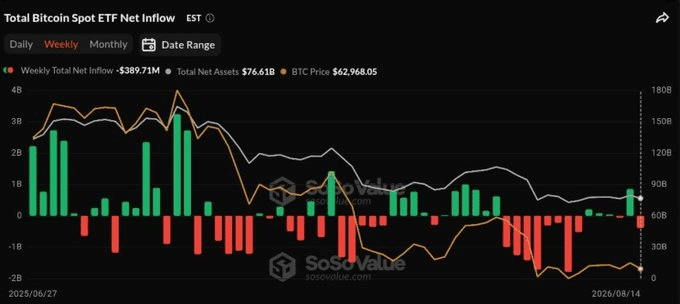
This further solidifies the case for the $ETH/$BTC ratio.
From a technical perspective, the alignment of on-chain indicators and momentum for Ethereum suggests that a price move may be on the horizon, as resistance has led to significant levels for both Bitcoin and Ethereum’s dominance. The increased institutional inflows into Ethereum imply that the market may be preparing for an upswing in $ETH.
The key determinant for the realization of this scenario is the $ETH/$BTC ratio. A breakout above 0.03 is achievable, especially considering the rise in institutional flows and the increasingly bullish on-chain signals for Ethereum.
Final Takeaway
- Ethereum is demonstrating resilience. Its selling pressure is decreasing, institutional investments are climbing, and the technical landscape is looking optimistic.
- A breach above 0.03 could lead to heightened capital inflows into Ethereum, whereas another setback could postpone the anticipated rally.