


Following the decline of the S2F model, the current power-law channel indicates that BTC is approximately 20% below its fair value. However, ETF inflows could potentially shift the price towards either of its extremes.
Bitbo’s interpretation of Giovanni Santostasi’s model estimates the price to hover around $109,700, with a fair value at $136,100. The support level is identified at $48,300, while resistance is seen at $491,800. This establishes the current market cycle within an upward-trending corridor based on the power-law analysis.
This channel is created by applying a linear regression of log(price) against log(time since inception, thus generating upper and lower bounds that have historically contained cyclical price extremes.
The resulting pathway can be viewed as a time-based compounding curve, refined over time, serving as a location map rather than a singular price prediction.
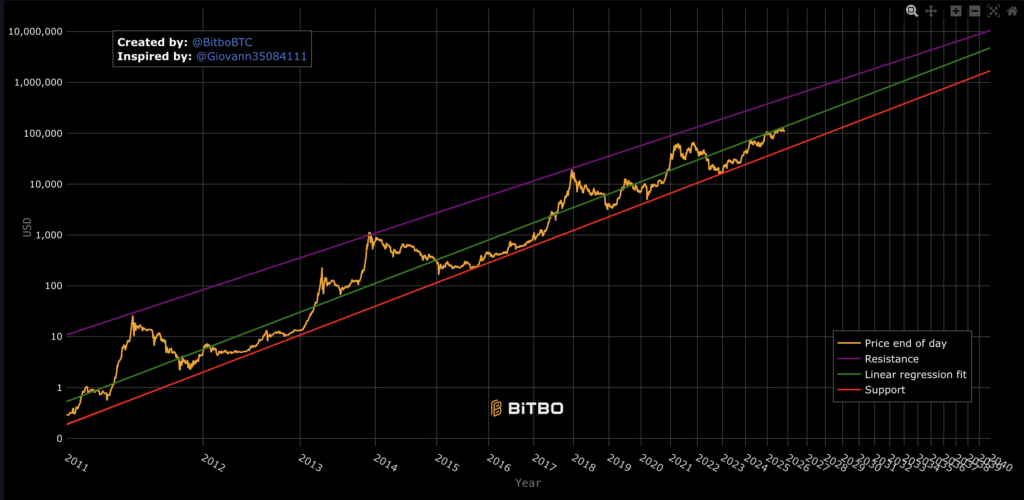
Evaluating the current market, Bitcoin trades roughly 20% below the fair-value regression and is positioned significantly above the model’s lower bound—this positioning is a departure from prior market tops and bottoms which typically hit either resistance or support.
The parameterization provided by BGeometrics reflects the fair-value curve as P ≈ 1.0117×10^-17 × (days since genesis)^5.82, with a conventional floor around 0.42 times the curve, consistent with the gap noted between the current spot price and Bitbo’s lower rail.
This formulation accommodates historical downturns and anticipates late-market overextensions towards the upper boundary.
Such a model operates under the premise that adoption follows a power function over time, suggesting that volatility may reduce as the network matures—this has been evident in an observed tightening of oscillations surrounding the regression line over multiple cycles.
Bitcoin Navigates its Power-Law Channel as ETFs Reshape the Landscape
The recent market dynamics clarify why Bitcoin’s price rests in the middle of the power-law channel instead of straying towards its extremes. During the week ending October 4, 2025, crypto exchange-traded products (ETPs) recorded an unprecedented $5.95 billion in net inflows, propelling Bitcoin’s price to an all-time high of approximately $126,000, fueled by robust demand for U.S. spot Bitcoin ETFs.
However, the following weeks exhibited a fluctuation in flows; CoinShares highlighted a swing to $3.17 billion in net inflows, followed by a drop to $513 million in outflows, including a notable single-week Bitcoin exit of $946 million.
In just two days, $958 million flowed out of U.S. Bitcoin ETFs, with $290 million attributed to BlackRock on October 30.
This pattern aligns with the power-law framework, with episodic demand spikes or sell-offs nudging the price towards the outer boundaries of the channel over short timeframes, while the long-term trend remains anchored to the time-based power curve. The recent October highs correlate with the significant uptick in ETF subscriptions, which are quickly becoming a crucial driver for crypto market demand.
Looking ahead, the critical consideration is not whether the power-law structure retains its relevance, but rather where Bitcoin will position itself within the channel in the next phase.
A cautious outlook suggests the price may continue to fluctuate around the regression line, currently estimated at $136,100, with a reduced amplitude if volatility continues to decline.
A more optimistic projection would see ongoing ETF inflows and stable macro conditions pushing prices closer to the upper resistance of around $491,800, a level previously reached during extended market rallies.
Conversely, a bearish outcome could emerge from tightening monetary policies, regulatory hurdles, or sustained ETF outflows leading to a retest of the lower rail near $48,300, a historical point where capitulative sell-offs have occurred prior to re-entering the channel.
These thresholds adjust over time as the exponent influencing days since inception compounds, implying that the boundaries act as directional guides rather than fixed endpoints.
For those monitoring key price points, the current model provides the following ranges:
| Measure | Level |
|---|---|
| Spot price | ≈ $109,700 |
| Fair-value regression | ≈ $136,100 |
| Support (floor band) | ≈ $48,300 |
| Resistance (upper band) | ≈ $491,800 |
The Discussion of Model Validity Post-S2F Collapse
The collapse of the once-cherished Stock-to-Flow model has stirred debate over the suitability of different valuation methods.
PlanB’s S2F projections anticipated Bitcoin reaching $98,000 by November 2021 and $135,000 by December 2021—figures that the market never met.
Subsequently, Bitcoin spent several years trading beneath the S2F trajectory, which has diminished confidence in relying solely on a stock-to-flow ratio for setting price projections.
Critics, including Vitalik Buterin, have voiced concerns over S2F’s misleading precision, while many analysts have pointed out various methodological flaws, such as overfitting, neglect of demand and liquidity factors, and treating halvings as mere valuation shifts that overlook market intricacies.
Institutional analysts continue to warn that S2F lacks reliability for determining long-term pricing, instead relegating it to a narrative of scarcity rather than a forecasting tool.
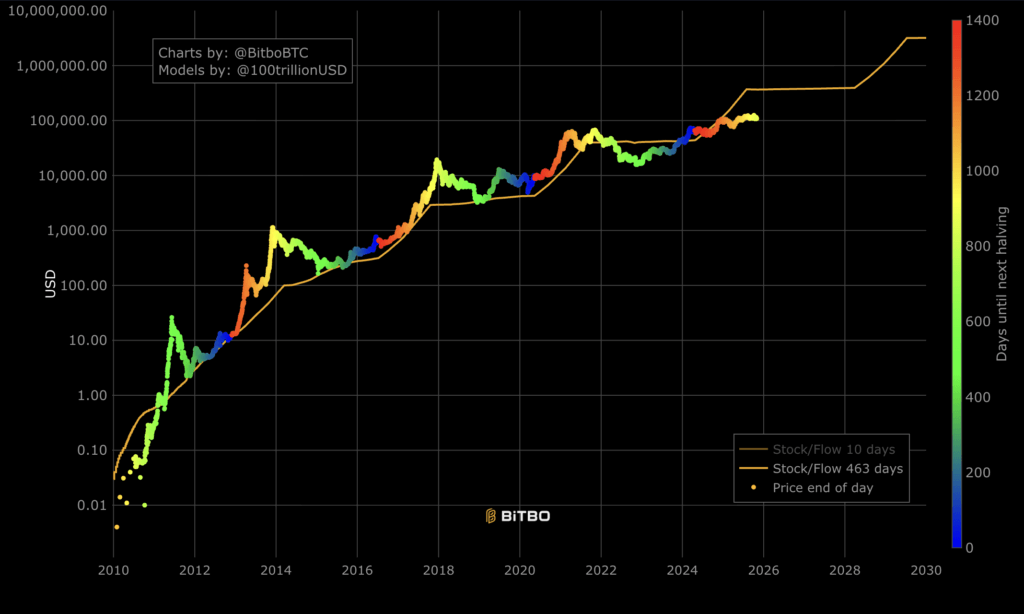
Advocates of the power-law model, however, contend that it can effectively bound the cycle length and amplitude without strictly dating outcomes.
CryptoSlate has previously discussed extensive ranges in which Bitcoin is not expected to diminish significantly.