

The price of Bitcoin has retreated to approximately $65,700 after nearly hitting $67,000, as concerns surrounding Alphabet’s earnings and a significant surge in oil prices led traders to adopt a more cautious approach towards riskier assets.
Summary
- The Bitcoin price has dropped below $66,000, influenced by uncertainties regarding tech earnings and increasing oil prices.
- ETF inflows remain positive, while Bitcoin encounters a crucial market structure level near $66,950.
- A fall below $64,992 could reveal deeper support levels, whereas a breakout might lead to liquidations toward $68,000.
Recent reports from crypto.news indicate that Bitcoin (BTC) was trading around $65,970 at the time of writing, registering a daily decline of roughly 1.5% after achieving a peak of $66,886 earlier in the day. This decline follows a multi-day rebound from lows near $58,000 in July, but traders are hesitant to pursue the upward trend prior to the financial disclosures from major tech firms.
On Wednesday, U.S. stock futures dipped as investors awaited the earnings reports from Alphabet and Tesla. Alphabet is under particular scrutiny, with analysts eager to see if the company’s substantial investments in artificial intelligence can yield sustainable returns. Projections suggest its annual capital expenditure could reach between $180 billion and $190 billion, as reported by Reuters.
Concerns regarding semiconductor stocks have led to increased volatility amid expectations that tech companies might taper their AI infrastructure spending. Weakness in chip manufacturers could weigh on the Nasdaq and diminish demand for Bitcoin, which has displayed a strong correlation with high-growth equities during times of market uncertainty.
According to data from Farside Investors, U.S. spot Bitcoin ETFs saw net inflows of $203.2 million on July 21. BlackRock’s IBIT led the way with $163.9 million, followed by Fidelity’s FBTC with $23.1 million. This total represents a drop from the previous session’s $226.8 million, suggesting institutional interest remains positive, yet insufficient to drive BTC past the June high.
Bitcoin price needs a daily close above $67,000
On the 4-hour Bitcoin chart, $66,950 represents the upper boundary of the recovery phase initiated from a low of $57,799 on July 1. Buyers approached this level on Tuesday, but profit-taking subsequently pushed the price back under $66,000.
A confirmed close above $66,950 would mark Bitcoin’s first daily higher high since the rally in May, potentially turning $67,000 into a new support level. Trader Daan Crypto Trades noted that breaking above the June peak would create a “daily bullish market structure break,” paving the way for higher prices.
The daily chart provides a positive backdrop as well. Bitcoin is trading above the 20-day and 50-day simple moving averages at $64,065 and $63,135, respectively, marking the initial dynamic support area. The Chaikin Money Flow indicator at 0.13 indicates that recent inflows have outpaced outflows during the recovery.
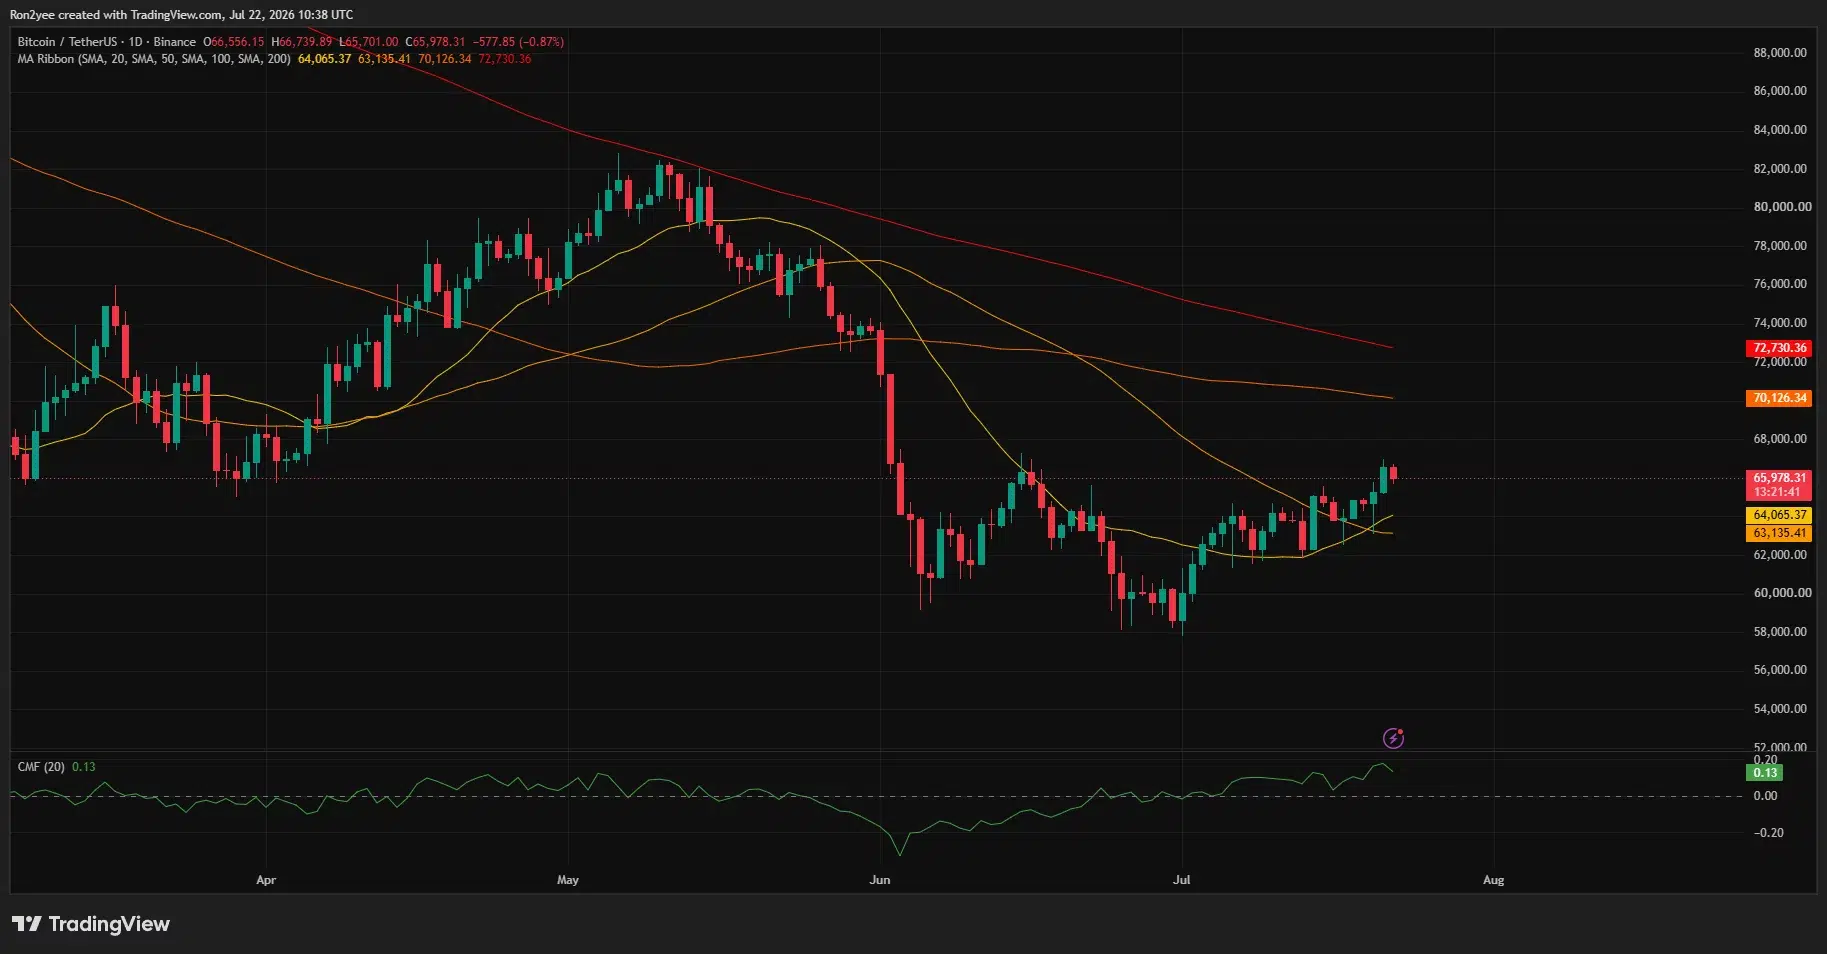
Longer-term resistance remains considerably further ahead. Bitcoin continues to trade below the 100-day SMA at $70,126 and the 200-day SMA at $72,730, indicating that the daily trend has yet to reverse fully. An extended move above these averages would spotlight the $76,000 region, lessening the impact of the decline from May’s high near $82,000.
Analyst Ted Pillows also pointed out that Bitcoin’s daily Supertrend has transitioned from bearish to bullish. In comparing this setup to a previous signal, Pillows stated:
“The last time this occurred, Bitcoin increased by nearly 15% over four weeks. A similar rise could see BTC reaching $76,000 by August.”
While momentum remains positive, some strength has diminished following the recent pullback. The 4-hour relative strength index has dipped to 58.09 from above 60, keeping Bitcoin out of overbought conditions. The MACD is still above its signal line, but the decreasing positive histogram indicates that buying activity is slowing.
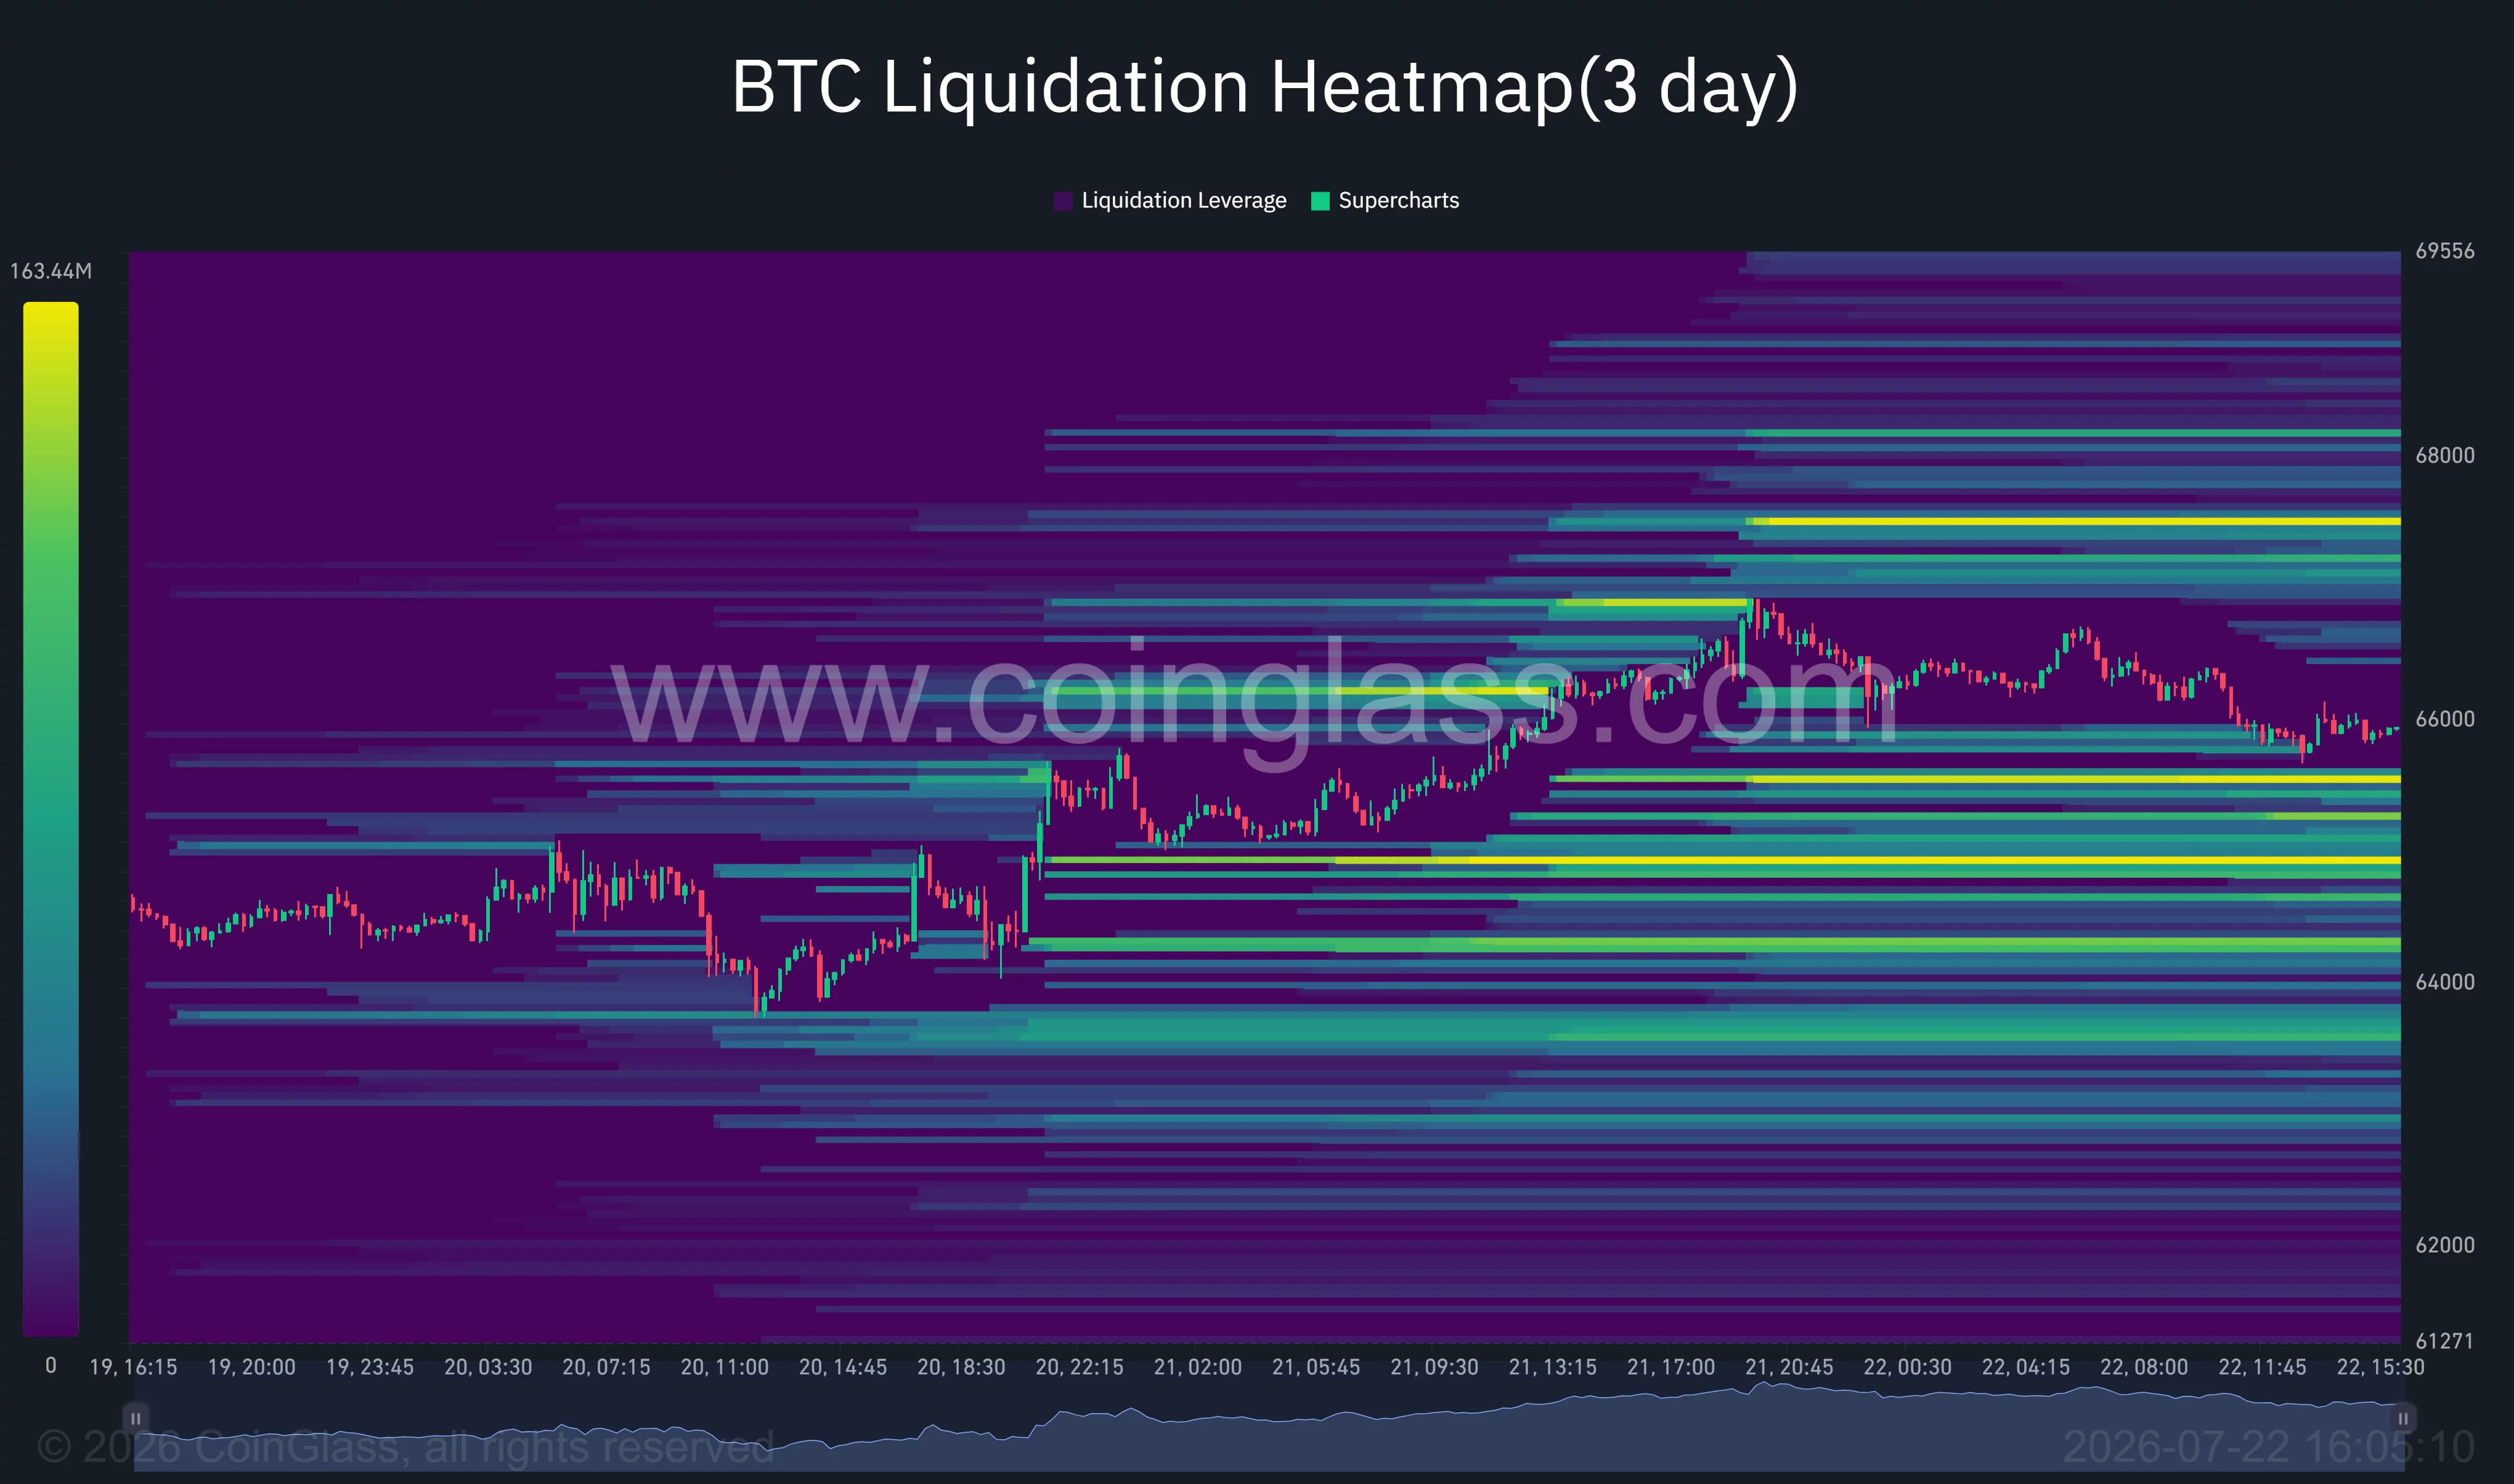
According to CoinGlass’ three-day liquidation heatmap, there is a substantial short-liquidation pool centered around $67,300, with another significant zone near $68,000. A breakout above $66,950 could prompt leveraged sellers to liquidate their positions, potentially generating the momentum needed to test these areas. Conversely, long-liquidation clusters exist around $65,500, $64,700, and $64,300.
Oil Prices and Federal Reserve Risks Challenge the Recovery
WTI crude oil jumped over 4% to $87.99 on Wednesday, while Brent oil surpassed $94, amid escalating tensions between the U.S. and Iran that raised concerns about supply routes. President Donald Trump has dismissed immediate negotiations with Iran and threatened further action against a suspected nuclear facility. Additional risks have been introduced due to Houthi threats affecting shipping lanes around the Red Sea and Bab el-Mandeb Strait.
Higher energy prices could extend inflation pressures and limit the Federal Reserve’s ability to provide market support. A survey conducted in July indicated that economists anticipate the Fed will maintain its policy rate of 3.50%–3.75% through 2026, although a growing number expect a possible increase. Rising oil prices and high Treasury yields could create additional hurdles for speculative assets like Bitcoin.
A 4-hour close beneath the 78.6% Fibonacci level at $64,992 would weaken the current recovery trend and expose deeper levels at $63,455, followed by $62,375. Losing the daily moving average cluster near $63,100 would negate the immediate bullish outlook and could drive Bitcoin down to $61,295.
For the bullish scenario to remain viable, Bitcoin needs to maintain the $65,000 level and secure a decisive close above $66,950. Until then, external factors such as oil prices, Alphabet’s earnings, and leveraged market positions keep BTC vulnerable to a potential liquidity sweep below the current range.
Disclosure: This article does not constitute financial advice. The material and information provided herein are intended solely for educational purposes.