

Ethereum’s price has surged past the $1,700 mark as easing geopolitical issues and increased whale activity boost hopes for a potential escape from its recent bearish trend.
Data from crypto.news indicates that Ethereum ($ETH) rose by nearly 4% on June 15, surpassing $1,720, aided by a drop in oil prices following the reopening of the Strait of Hormuz. This development has alleviated immediate inflation concerns that had been affecting riskier assets. This rebound follows a period of significant selling, which had seen $ETH drop from over $2,000 earlier in the month to near a local low of around $1,510.
The increase in Ethereum’s price coincided with Bitcoin’s roughly 3% gain and a revival in tech stocks, helping $ETH to recover from last week’s downturn and regain a crucial psychological threshold.
Additionally, $ETH has seen renewed interest from whales. According to Lookonchain, a whale wallet acquired another 5,818 $ETH worth approximately $10 million, continuing a series of recent purchases.
A prominent whale, 0x54d2, borrowed an additional $10 million in $USDe from #Aave and purchased 5,818 $ETH at $1,719.
This whale has borrowed a cumulative total of $153 million in stablecoins from Aave.
Currently, their health rate stands at 1.21, with an estimated liquidation price around $1,420. https://t.co/MR2FpB1c20 pic.twitter.com/KM1sIP10S0
— Lookonchain (@lookonchain) June 15, 2026
However, not all participants in the market share this renewed optimism. Data from SosoValue highlights that spot Ethereum ETFs have experienced five consecutive weeks of net outflows, with nearly $900 million exiting these funds during that timeframe. This persistent trend indicates that many institutional investors remain wary, even amidst the recent price recovery.
Further insights from market analysts suggest that the selling pressure may be lifting. Whale Factor stated that “the market is running out of active sellers,” pointing out that outflows from Bitcoin and Ethereum investment products have sharply decreased in comparison to the previous week.
Ethereum Surpasses Short-Term Resistance
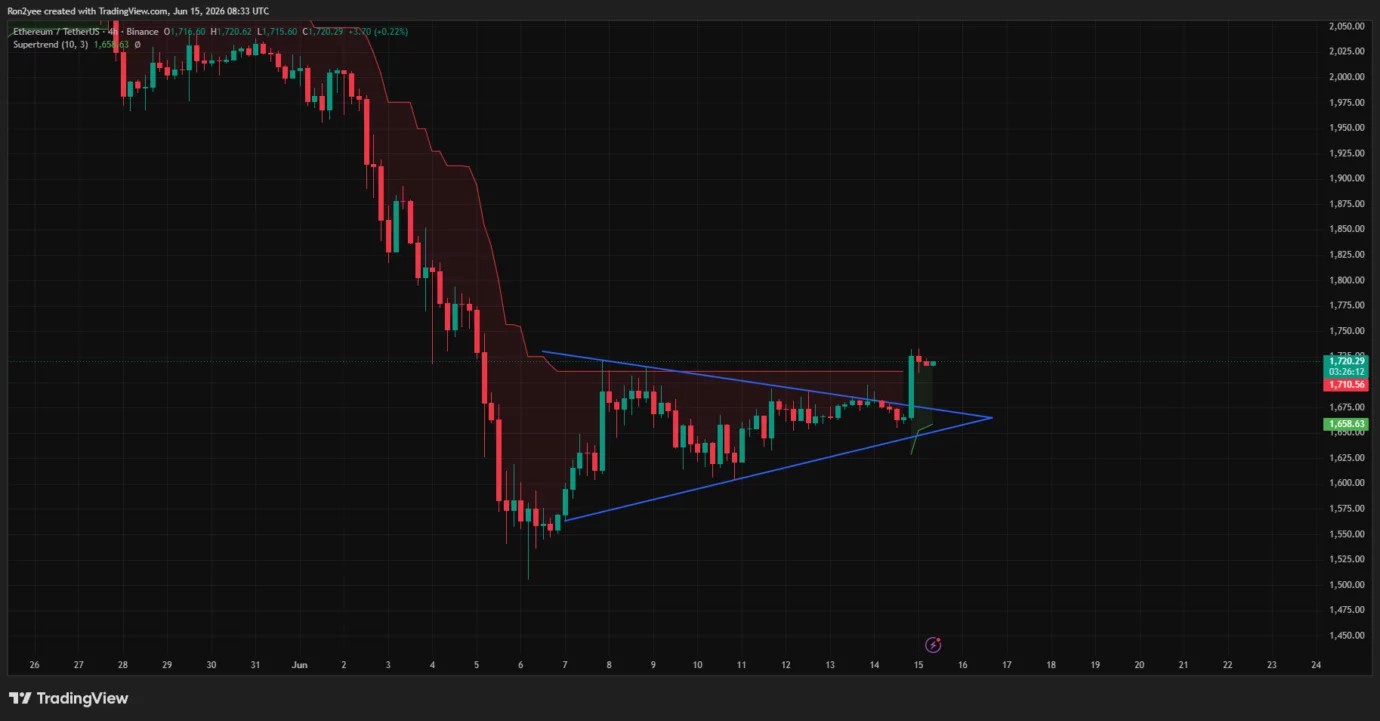
On the four-hour chart, Ethereum has breached a symmetrical triangle pattern that had developed since the low of June 6, close to $1,510. This breakout has pushed the price above the triangle’s upper trendline, reestablishing itself above the $1,700 mark, while the Supertrend indicator has turned bullish, showing support near $1,658.
Momentum indicators have also shown improvement. On the daily chart, the RSI has risen from a deeply oversold state to about 37, while the MACD histogram has turned positive for the first time in several sessions. The price of $ETH has regained the 0.786 Fibonacci retracement level near $1,707, derived from the June decline between $2,426 and $1,511.
Despite this short-term advancement, the daily chart reveals that Ethereum is still within a broader bearish flag, which formed after the decline earlier in June. The price is currently testing the upper boundary of this pattern, near the $1,750-$1,800 range—an area that could determine if the recent recovery translates into a more significant trend reversal.
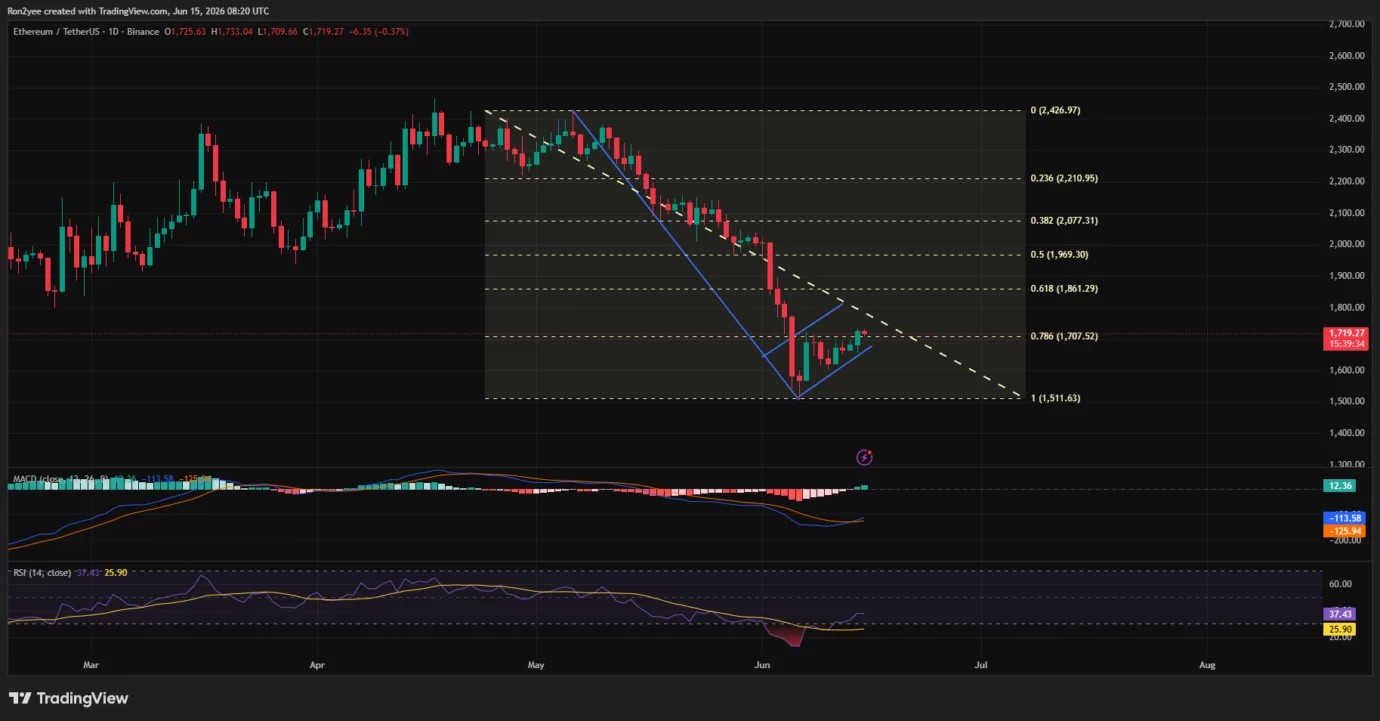
A decisive breakthrough above this level could negate the bearish formation and pave the way toward the $1,850-$1,900 zone, whereas a rejection would maintain the flag structure and increase the risk of another downward move.
A crypto analyst, Ted Pillows, commented on the current $ETH situation, asserting that Ethereum has already surpassed its short-term downtrend.
“$ETH has successfully exited its short-term downtrend. If Ethereum can break above the $1,700 mark, it may surge towards the $1,850-$1,900 levels.”
The next key technical obstacle lies around $1,860, which corresponds with the 0.618 Fibonacci retracement level. Successfully moving through this area would draw attention back to the psychological $1,900 mark and potentially challenge the descending trendline that has constrained rallies since May.
Furthermore, the derivatives markets indicate traders are re-entering bullish positions. Funding rates have shifted back into positive territory after being below neutral levels during much of the recent decline, reflecting that leveraged traders are willing to pay to maintain their long exposure.
Liquidation Clusters Present Both Upside Opportunities and Risks
According to CoinGlass liquidation data, there exists a notable concentration of short liquidations between $1,740 and $1,760, with another significant cluster extending toward $1,790. A move into these ranges could trigger additional short covering, accelerating upward price movement.
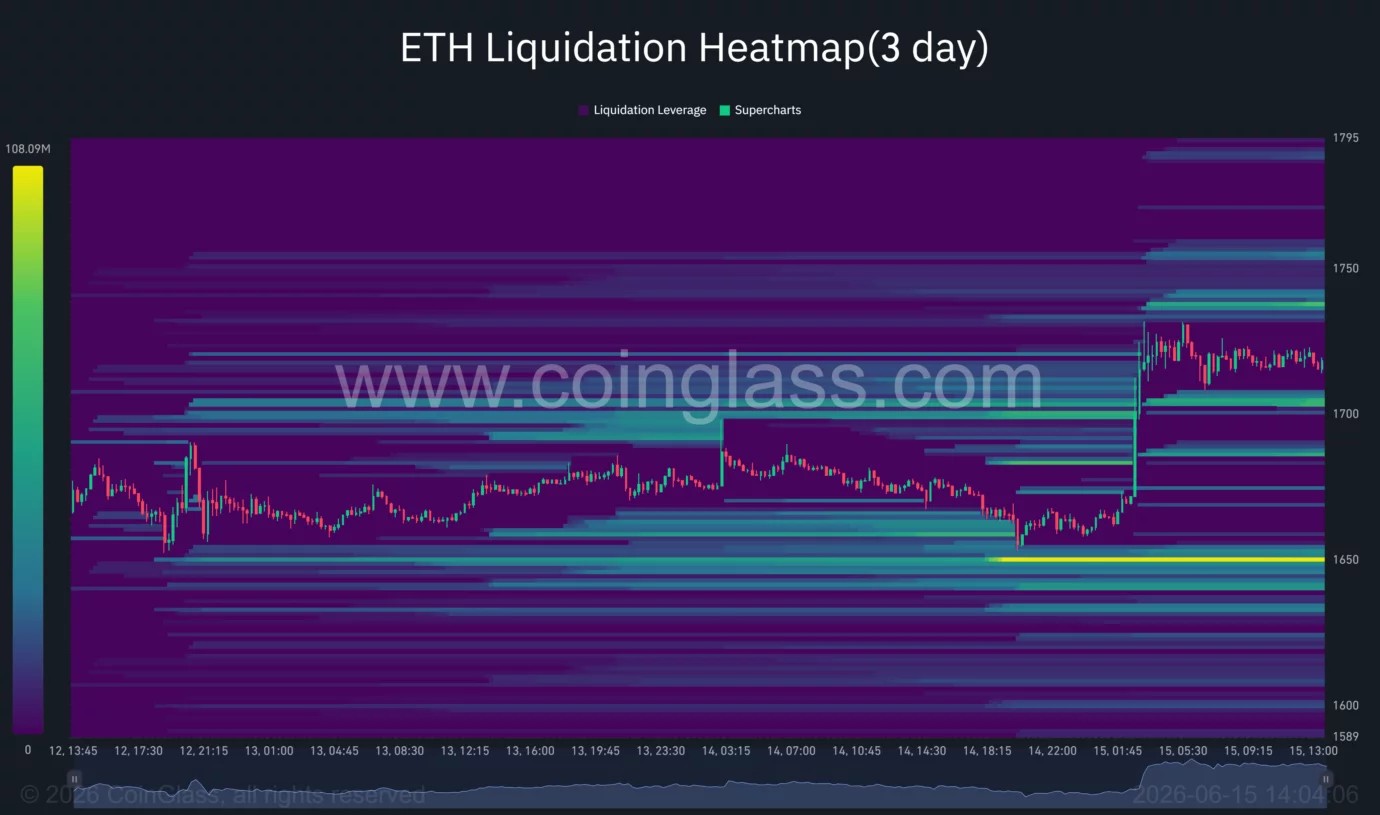
Below current levels, the largest liquidity zone remains near $1,650. The heatmap indicates significant leveraged positions at this level, making it a crucial support area for bullish traders.
A loss of this support could expose Ethereum to a downturn towards the whale liquidation zone around $1,420.
Fundamental risks remain pertinent as well. Ethereum is under pressure from declining token burn rates, with Layer-2 networks capturing transaction activities while generating fewer fees for the main chain.
Additionally, persistent ETF outflows and shifts in capital towards artificial intelligence stocks have limited demand for large-cap altcoins throughout the course of 2026.
While Ethereum has achieved a technical breakout and attracted fresh interest from whales, a comprehensive recovery will likely hinge on bulls protecting the $1,650-$1,700 range and breaking through the dense resistance area between $1,850 and $1,900.