

On July 28, XRP’s value declined approximately 5% to $1.05 as a broader risk-averse trend and enforced long position liquidations pushed the cryptocurrency below a critical technical support level.
Summary
- XRP decreased from about $1.11 to $1.05, breaking through the support level around $1.054.
- The 4-hour RSI dropped to 25.93, indicating that XRP is in oversold territory.
- Daily Chaikin Money Flow dipped to -0.12, suggesting ongoing net capital outflows.
- Liquidation clusters at $1.075 and $1.097 might restrict a quick recovery.
XRP’s Price Falls Below a Double-Top Neckline
As reported by crypto.news, XRP (XRP) was trading at $1.049 at the time of this report, having hit an intraday low of $1.0486 on Binance. This decline extends a larger downtrend that has pressured the token since May.
Analysis of the 4-hour chart reveals that XRP formed two rounded peaks near $1.17, indicating a double-top pattern. Both attempts to rise failed to gain traction, preventing buyers from establishing support above the $1.15 mark.
A horizontal neckline near $1.054 marked the boundary of the bearish confirmation for the pattern. XRP fell below this level on July 28, putting the psychological $1 mark and the late-June lows between $1.01 and $1.03 at risk.
This drop followed several unsuccessful attempts to maintain a price around $1.11 in previous sessions. Sellers gained the upper hand once XRP fell below $1.08, with the pace of decline accelerating as it approached the double-top neckline.
Momentum indicators reflect the rapidity of this movement. XRP’s 4-hour relative strength index plummeted to 25.93, indicating an oversold condition with values below the typical threshold of 30. Its RSI moving average, on the other hand, was significantly higher at 41.94, suggesting that short-term momentum weakened quickly.
While oversold readings can sometimes lead to a short-term rebound, they do not assure that a bottom has been reached. XRP would need to reclaim the crucial $1.054 level and confirm a higher low for recovery.
Liquidation Events Fuel XRP’s Drop
According to CoinGlass, XRP experienced a drop from approximately $1.105 to $1.05 as the market navigated various leveraged trading zones.
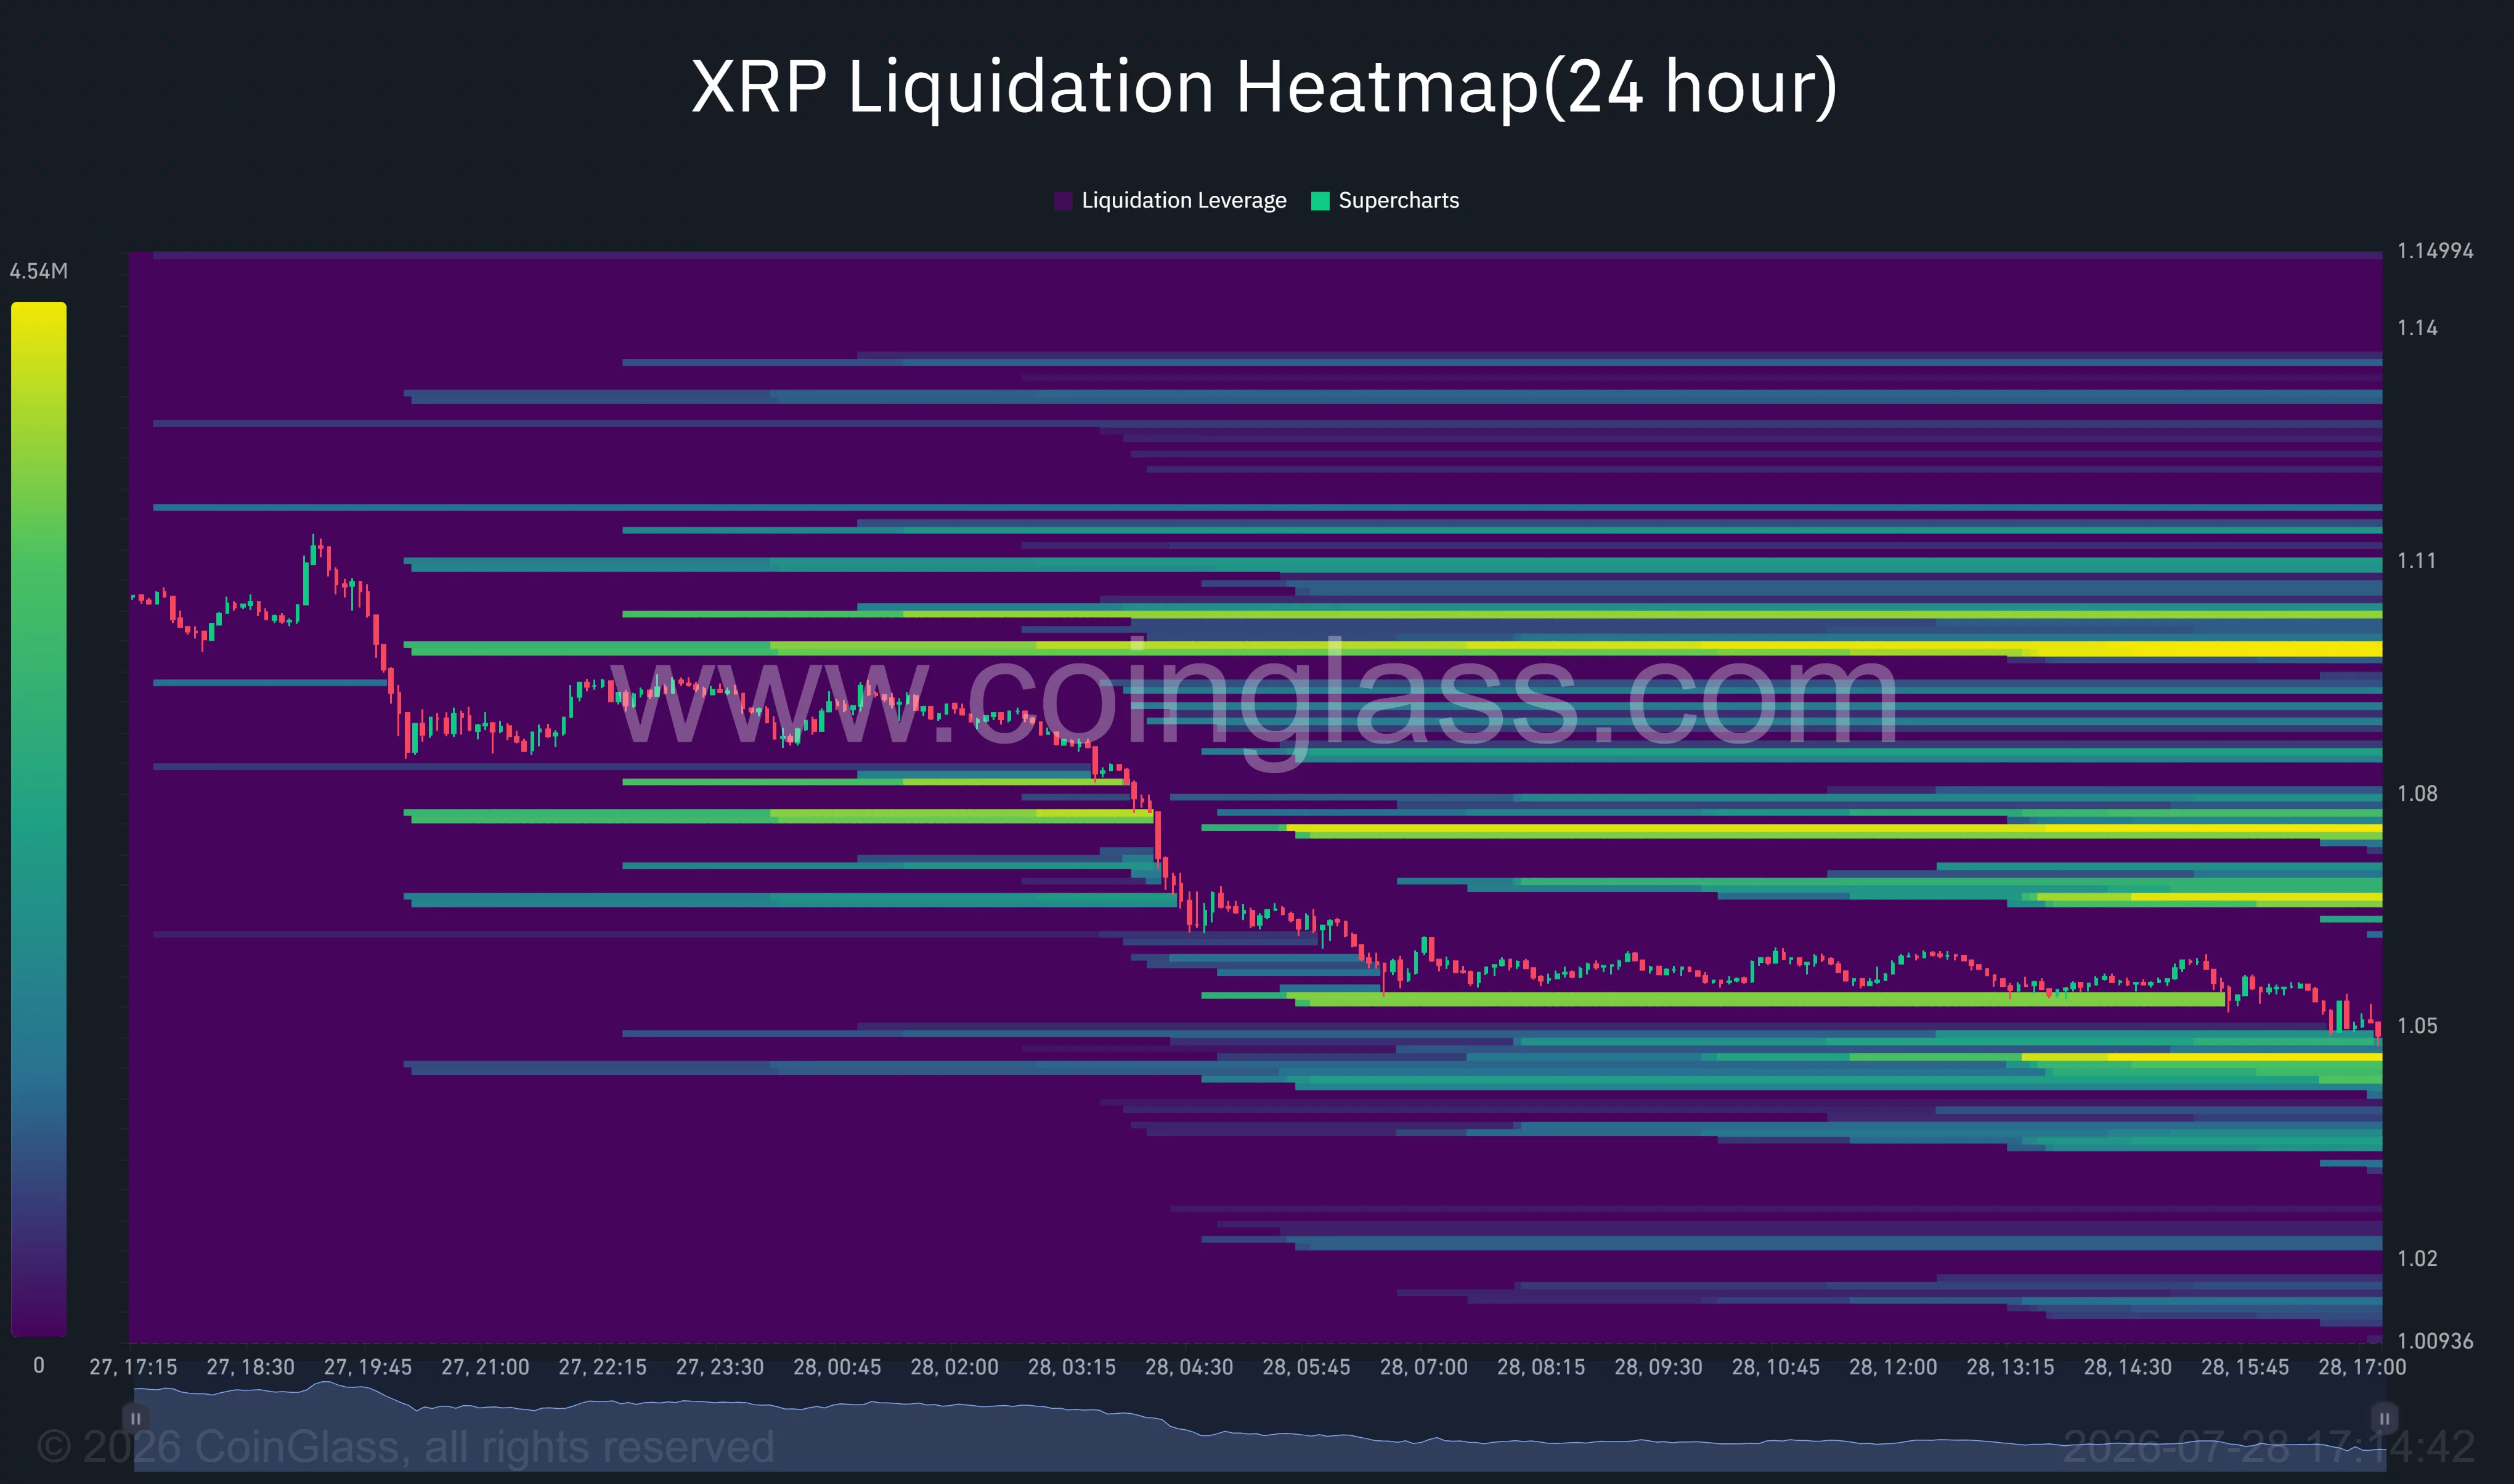
The initial plunge eliminated liquidity around $1.095 and $1.08. Following that breakdown, the price quickly approached $1.06 as long positions were liquidated and stop-loss orders took effect.
XRP is currently situated near another significant liquidity zone between $1.043 and $1.05, which may slow its decline temporarily. However, a decisive move through this area could lead to less visible support before reaching the $1.02 mark.
Most larger outstanding liquidity pools exist above the prevailing price. The liquidity heatmap highlights concentrations near $1.062, $1.075, and $1.097, with the most substantial cluster just below $1.10.
These areas may attract price movements during a recovery, as traders tend to aim for locations where short positions are at risk. Conversely, they could serve as resistance if holders decide to leverage a recovery to minimize their exposure.
A notable factor contributing to the selling pressure involved more than 150 million XRP transferring from private wallets to centralized exchanges over a 48-hour period. Without identifiable transaction details or wallet labels, these transfers should be interpreted as a potential catalyst rather than conclusive evidence of sales.
Indicators Suggest Continued Selling Pressure for XRP
The daily chart for XRP indicates a close below the lower Bollinger Band, which was around $1.0538. Closing outside this band suggests exceptionally strong downward momentum, albeit it raises the likelihood of a short-term mean-reversion move.
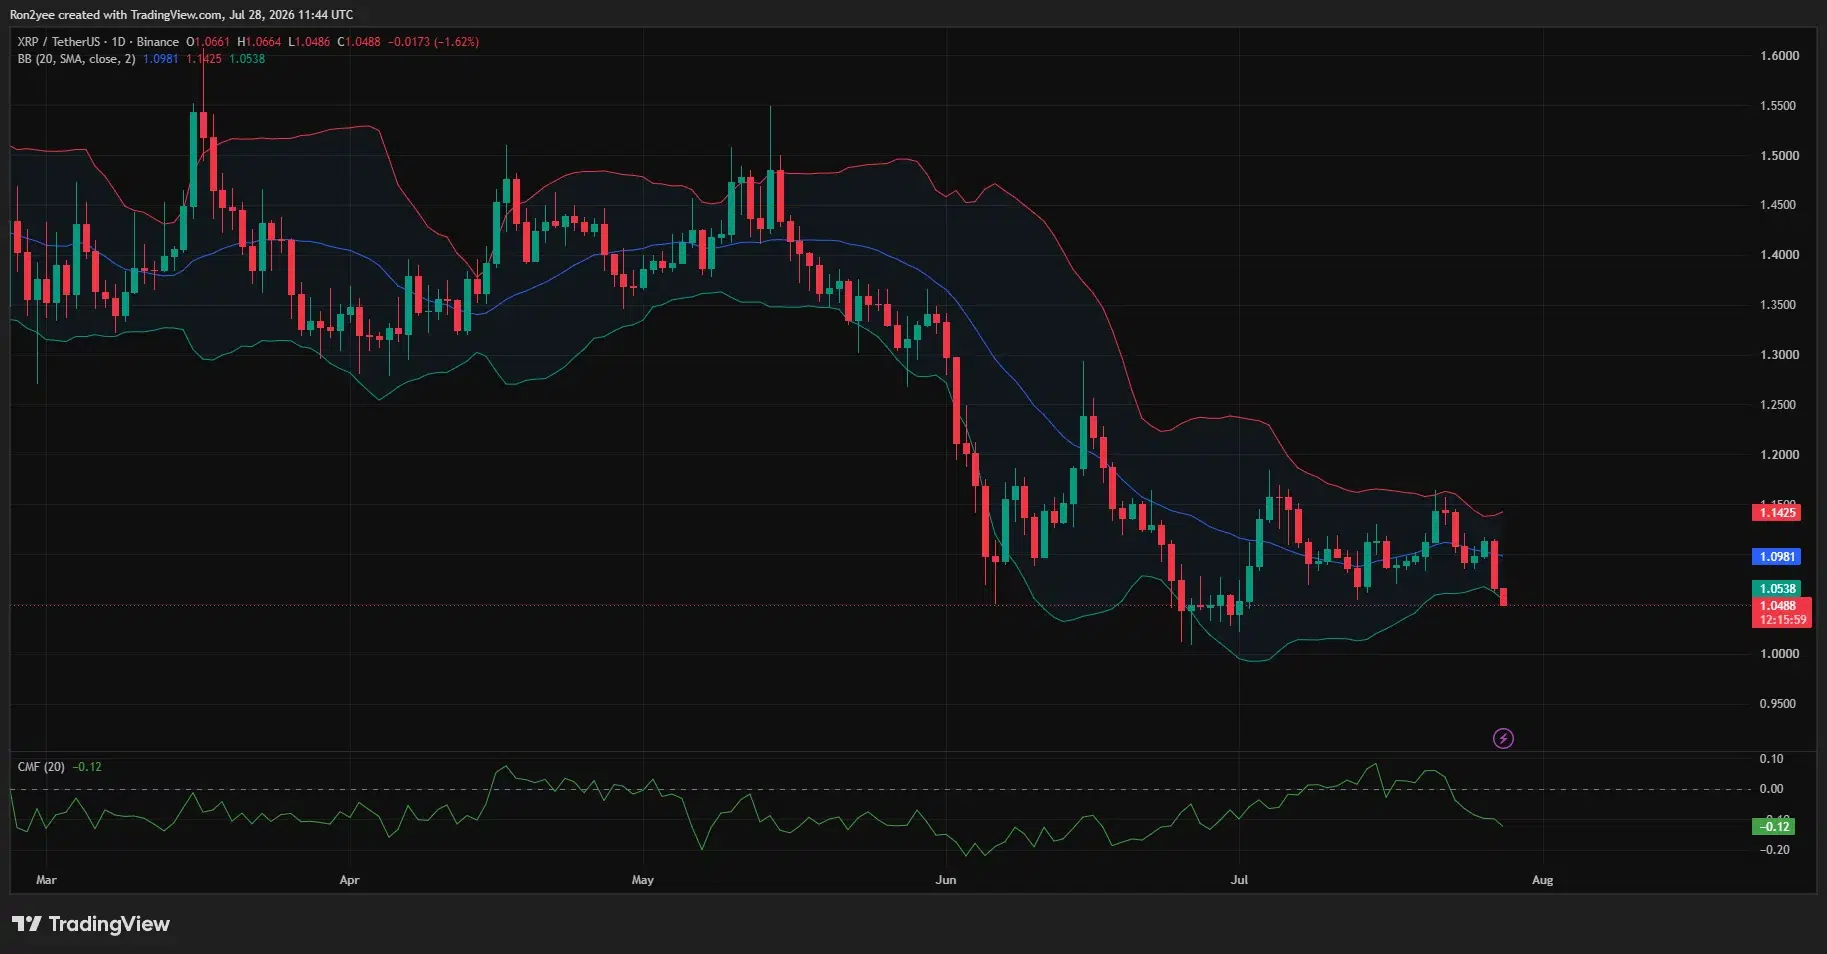
The midpoint of the Bollinger Band stands around $1.0981, closely aligned with the strongest nearby liquidity area on the heatmap. A recovery past this point would reestablish XRP within its recent trading range, potentially alleviating the immediate bearish outlook.
The upper band is much higher, positioned at $1.1423. XRP would need to reestablish itself in this zone for the daily structure to shift away from the series of lower highs formed since May.
Currently, the Chaikin Money Flow registers -0.12 on the daily chart, indicating that selling pressure has eclipsed buying efforts during its 20-day evaluation.
The 4-hour moving average convergence divergence indicator remains negative, with the MACD line at -0.0125, positioned below its -0.0072 signal line, and the histogram at -0.0052.
Immediate support is noted between $1.043 and $1.05. Should these levels fail, traders may turn their attention to $1.02 and $1.00. Resistance is identified around $1.054, $1.075, and $1.098, followed by previous resistance levels near $1.11.
Global Market Retreat Increases Pressure Ahead of Federal Reserve Meeting
The decline in XRP came in tandem with a significant selloff in Asian technology stocks. The South Korea Kospi index saw a downturn of 10.84%, largely influenced by losses from Samsung Electronics and SK Hynix, its sharpest drop in five months.
This selling trend echoed across other Asian exchanges, driving traders toward safer positions ahead of the Federal Reserve’s meeting set for July 28–29. Heightened market volatility often affects altcoins as traders typically pull back from speculative assets first.
Meanwhile, the sentiment surrounding crypto faced challenges due to a policy setback in the U.S. Senate, which temporarily sidelined the Digital Asset Market Clarity Act in favor of federal nominations and a sanctions bill against Russia. This reduced the timeline available before the upcoming August recess, according to CoinDesk.
Additionally, wallets connected to BlackRock’s ETFs moved about $271 million in Bitcoin and Ethereum to Coinbase Prime. Such transactions typically relate to ETF creation and redemption activities, meaning they don’t necessarily imply that BlackRock executed a market sale.
For U.S. XRP investors, the Federal Reserve meeting and remaining legislative schedules in the Senate are key external factors in the short term. Technically, maintaining the $1.043–$1.05 zone could lead to an oversold bounce. Conversely, a daily close below this threshold heightens the chances of a drop toward $1.
Disclosure: This article is not investment advice. The content presented on this page is intended solely for educational purposes.