
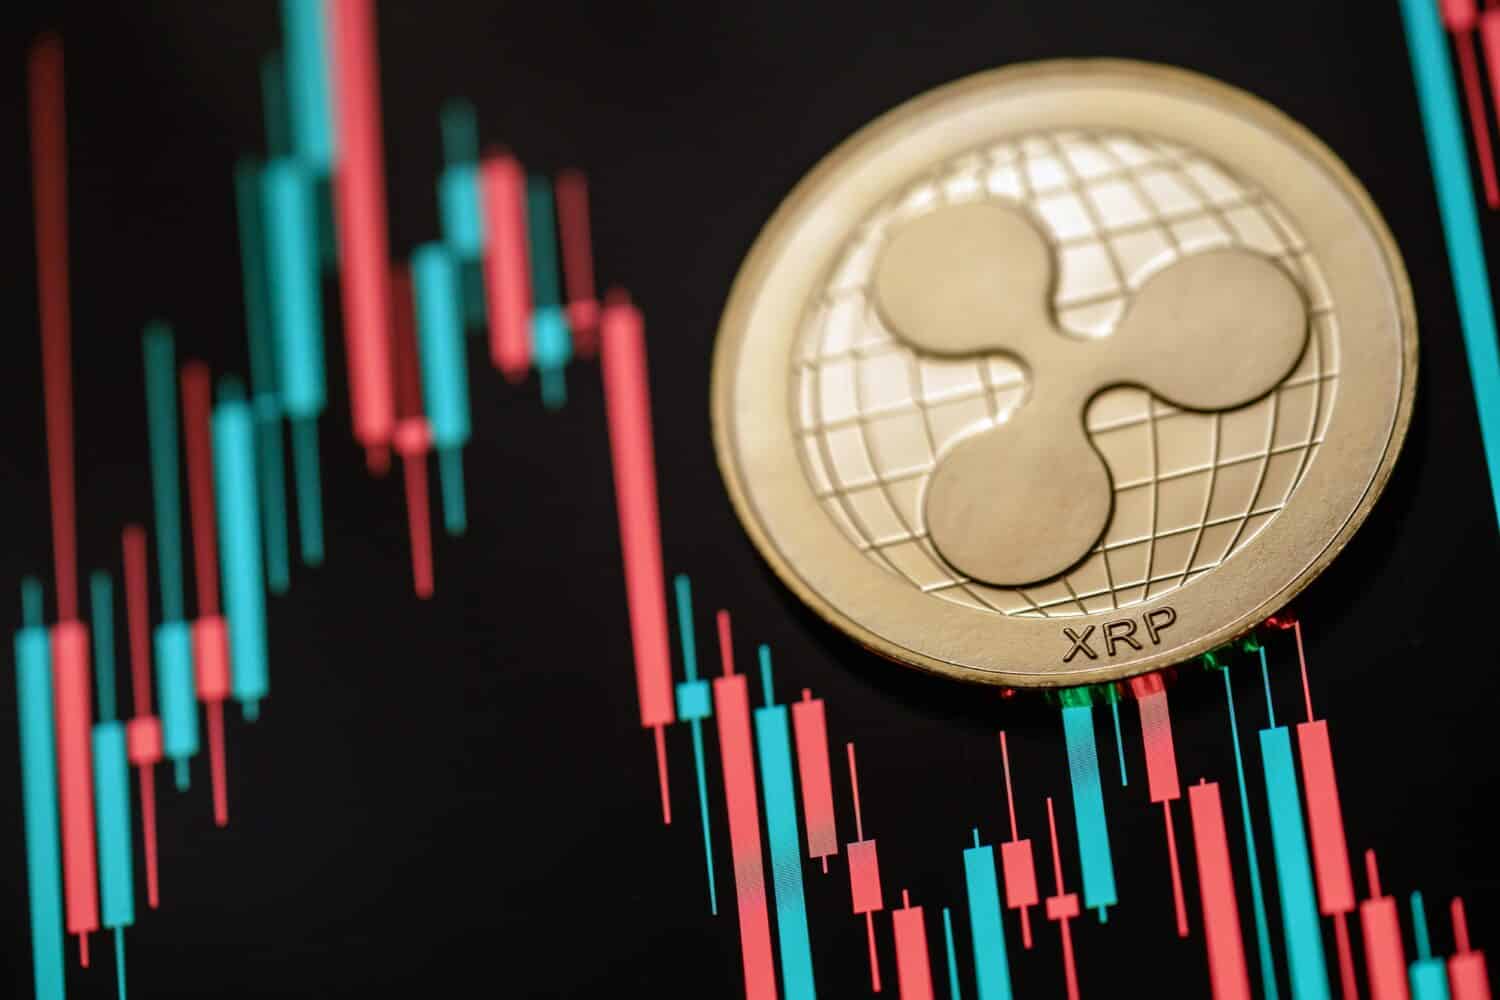
XRP recently established a notable double-bottom formation around the $1 threshold this summer and experienced a significant increase. However, buyers are now confronted with an essential challenge as the coin retraces toward the neckline that initially triggered the price surge.
This article may feature links from our sponsors and affiliates, and Flywheel Publishing might earn compensation for any actions taken through these links.
XRP (CRYPTO: XRP) demonstrated a double-bottom pattern close to the $1 level this summer. Following a dip to around $1.01 on June 26, 2026, it settled at nearly $1.03 on August 6, before bullish buyers entered the market. Subsequently, the coin skyrocketed about 46% to $1.53 by late September.
Nevertheless, XRP has since retraced some of its gains. As of October 10, it was priced around $1.41, reflecting a decline of roughly 5% over the previous week and standing about 61% below its all-time peak of $3.65.
This leads to the question: Is the XRP double bottom still resilient, or is the cryptocurrency heading back to its summer lows?
Understanding the Double Bottom Pattern and Its Confirmation
The double bottom is a chart formation that resembles the letter “W.” Initially, the price decreases to a certain level, rebounds, declines again to a similar level, and maintains that low. This second low is interpreted by traders as an indication that buyers are supporting the price, as it has returned to the same level twice.
This pattern is deemed confirmed only when the price closes above the highest point between the two lows, known as the neckline. Traders often seek lighter trading volume at the second low, indicating that sellers are losing momentum.
XRP’s Two Lows Around $1 Set the Stage for Summer Growth
XRP embodies this pattern effectively. Following the low on June 26, the coin traded between $1 and approximately $1.18 throughout July before dropping again to its lowest daily close of the year at around $1.03 on August 6. During this time, buyers defended the $1 level on both occasions.
Subsequently, XRP managed to close above the $1.18 to $1.20 range that had constrained its movements in July, effectively confirming the double bottom. A common evaluation method adds the pattern’s depth—approximately 18 cents—to the neckline, suggesting a potential target close to $1.37, which XRP surpassed by reaching $1.53 by late September.
Is XRP Capable of Maintaining the $1.20 Neckline Amidst the Pullback?
Despite the implications of a confirmed double bottom reflecting a bullish outlook, XRP has pulled back approximately 8% from its late-September high. Currently, traders are monitoring the $1.17 to $1.20 range—around 15% to 17% below the October 10 price—where the previous neckline overlaps with a 78.6% retracement of XRP’s increase from $0.50 to $3.65.
A retreat to a broken neckline is a frequent occurrence and is referred to as a retest. If buyers return at this level, the pattern will remain valid. Conversely, a daily close below approximately $1.17 might weaken the breakout and bring the summer lows near $1—around 29% below the October 10 price—back into consideration. Moreover, a wave of forced selling from leveraged traders can breach any chart levels, regardless of the established pattern.
Is XRP’s Double Bottom Status Holding Strong or Breaking Down?
At present, the XRP double bottom continues to hold firm. It is trading about 18% above its $1.20 neckline and approximately 37% above its August low, indicating that the recent 5% weekly decline seems more like a standard pullback within a confirmed pattern rather than a breakdown. For XRP investors, a retest in the $1.17 to $1.20 range could represent a 15% decline from the October 10 price.
A daily close below around $1.17 would diminish the validity of the double bottom pattern and potentially signal a regression towards $1. However, if XRP rises above $1.50—about 6% higher—buyers might proceed with the rally that commenced with the double bottom, targeting the late-September high of $1.53 next.
For any inquiries or corrections, please contact [email protected] for any questions or corrections.